


Hedera (HBAR) Price Remains Lower During Christmas Celebrations

- Hedera price (HBAR) is recovering costs after bouncing off the weekly low.
- The daily RSI indicator found support at 30 before moving towards the semi-line.
- Market capitalization increased by 3% in the last 24 hours to $1.08 billion.
HBAR, the native token of Hedera, has dropped dramatically in recent days. In fact investors also reduced HBAR Coin from their portfolios as it made another 52-week low this week. However, the HBAR is battling constant selling pressure and the bears are shifting each swing lower for a long period of time.
HBAR on 4 Hour Price Chart
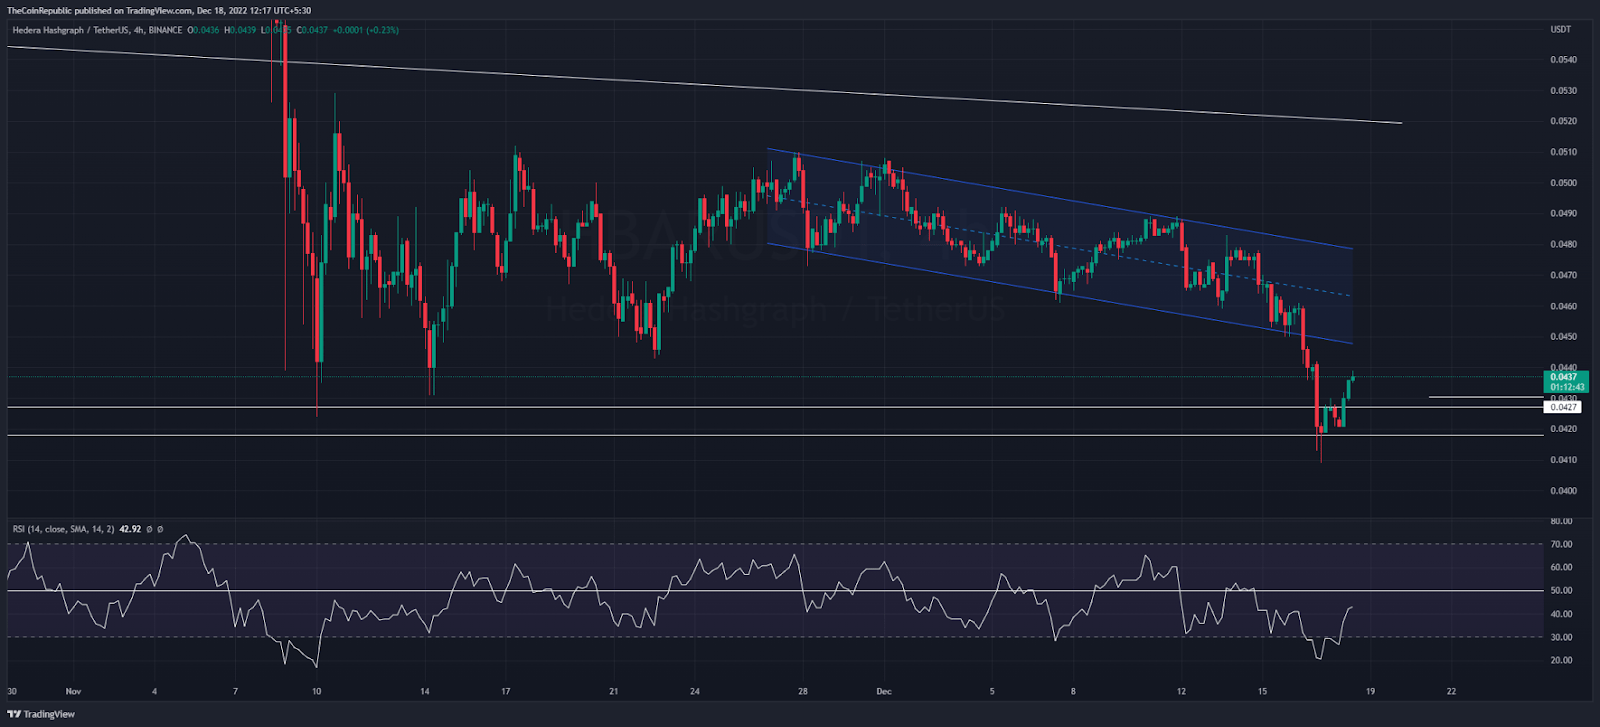
Source: HBAR/USDT by tradingview
Over the 4 hour chart, the HBAR coin was decreasing into a falling parallel channel a few days before. Due to aggressive selling crypto brokedown this bearish channel and recorded an 8.08% decline in a single day. Resulting in, buyers witnessed a 52-weeks low of $0.0409 on 17 December.
However, sellers seem exhausted after the recent breakdown, hence, HBAR price shows recovery since last night. Hourly price action draws higher-lows (above the chart). In the last two days, buyers recovered nearly 7% while the Hedera price was trading at $0.438 mark at press time.
Market capitalization rose 3% in the last 24 hours, $1.08 Billion. Despite the positive momentum, bears are going to form the third bearish candlestick this week along with an 8.37% drop. Buyers rely on this price recovery as hourly RSI indicator recovers from the oversold zone.
HBAR on Daily Price Chart

Source: HBAR/USDT by tradingview
On the daily price chart, buyers can take a deep breath as the RSI indicator found support at 30 before moving towards the semi-line. The trading volume is also decreasing during the recovery, this may help the bulls to maintain positive sentiment in HBAR coin. Besides, the choppiness index remains low, suggesting strength in recovery.
Conclusion
Hedera Coin (HBAR) has been in the green zone since last night. Bears can wait for the previous swing high retest before any aggressive selling. Notably, the RSI is marching higher, providing a positive outlook for the buyers.
Support level – $0.040
Resistance level – $0.050 and $0.0850
Disclaimer
The views and opinions stated by the author, or any people named in this article, are for informational ideas only, and they do not establish financial, investment, or other advice. Investing in or trading crypto assets comes with a risk of financial loss.


 Bitcoin
  Ethereum
  Tether
  USDC
USDC  Dogecoin
  Cardano
  Bitcoin Cash
  Polygon
  Litecoin
  LEO Token
  Hedera
  Cosmos Hub
  Stellar
  OKB
OKB  Maker
Maker  Algorand
  NEO
NEO  Gate
Gate  KuCoin
  Synthetix Network
  IOTA
IOTA  Tether Gold
  TrueUSD
  Enjin Coin
  Holo
Holo  Ravencoin
  Siacoin
  0x Protocol
  Zcash
Zcash  Basic Attention
  Decred
  Ontology
  Lisk
Lisk  Waves
Waves  DigiByte
  Numeraire
  Nano
Nano  Status
  Pax Dollar
  Steem
Steem  OMG Network
  BUSD
BUSD  Ren
Ren  Bytom
Bytom  Bitcoin Diamond
  Augur
Augur  Energi
  HUSD
HUSD