


Litecoin (LTC) Price Continues Ascent – Is $100 Within Reach?

The Litecoin (LTC) price broke out from a diagonal resistance line, accelerating its rate of increase and outperforming the rest of the crypto market.
The wave count in different time frames supports the continuing increase. As a result, the upward movement will likely continue.
LTC Price Bounce Leads to Breakout
The technical analysis from the daily time frame provides a bullish LTC price prediction. There are numerous reasons for this. Firstly, the price broke out from a descending resistance line that had been in place since April 18. This means that the previous correction is now complete.
Secondly, LTC completed an A-B-C corrective structure (white). Also, it further supports the possibility that the correction is complete and a new upward movement has begun.
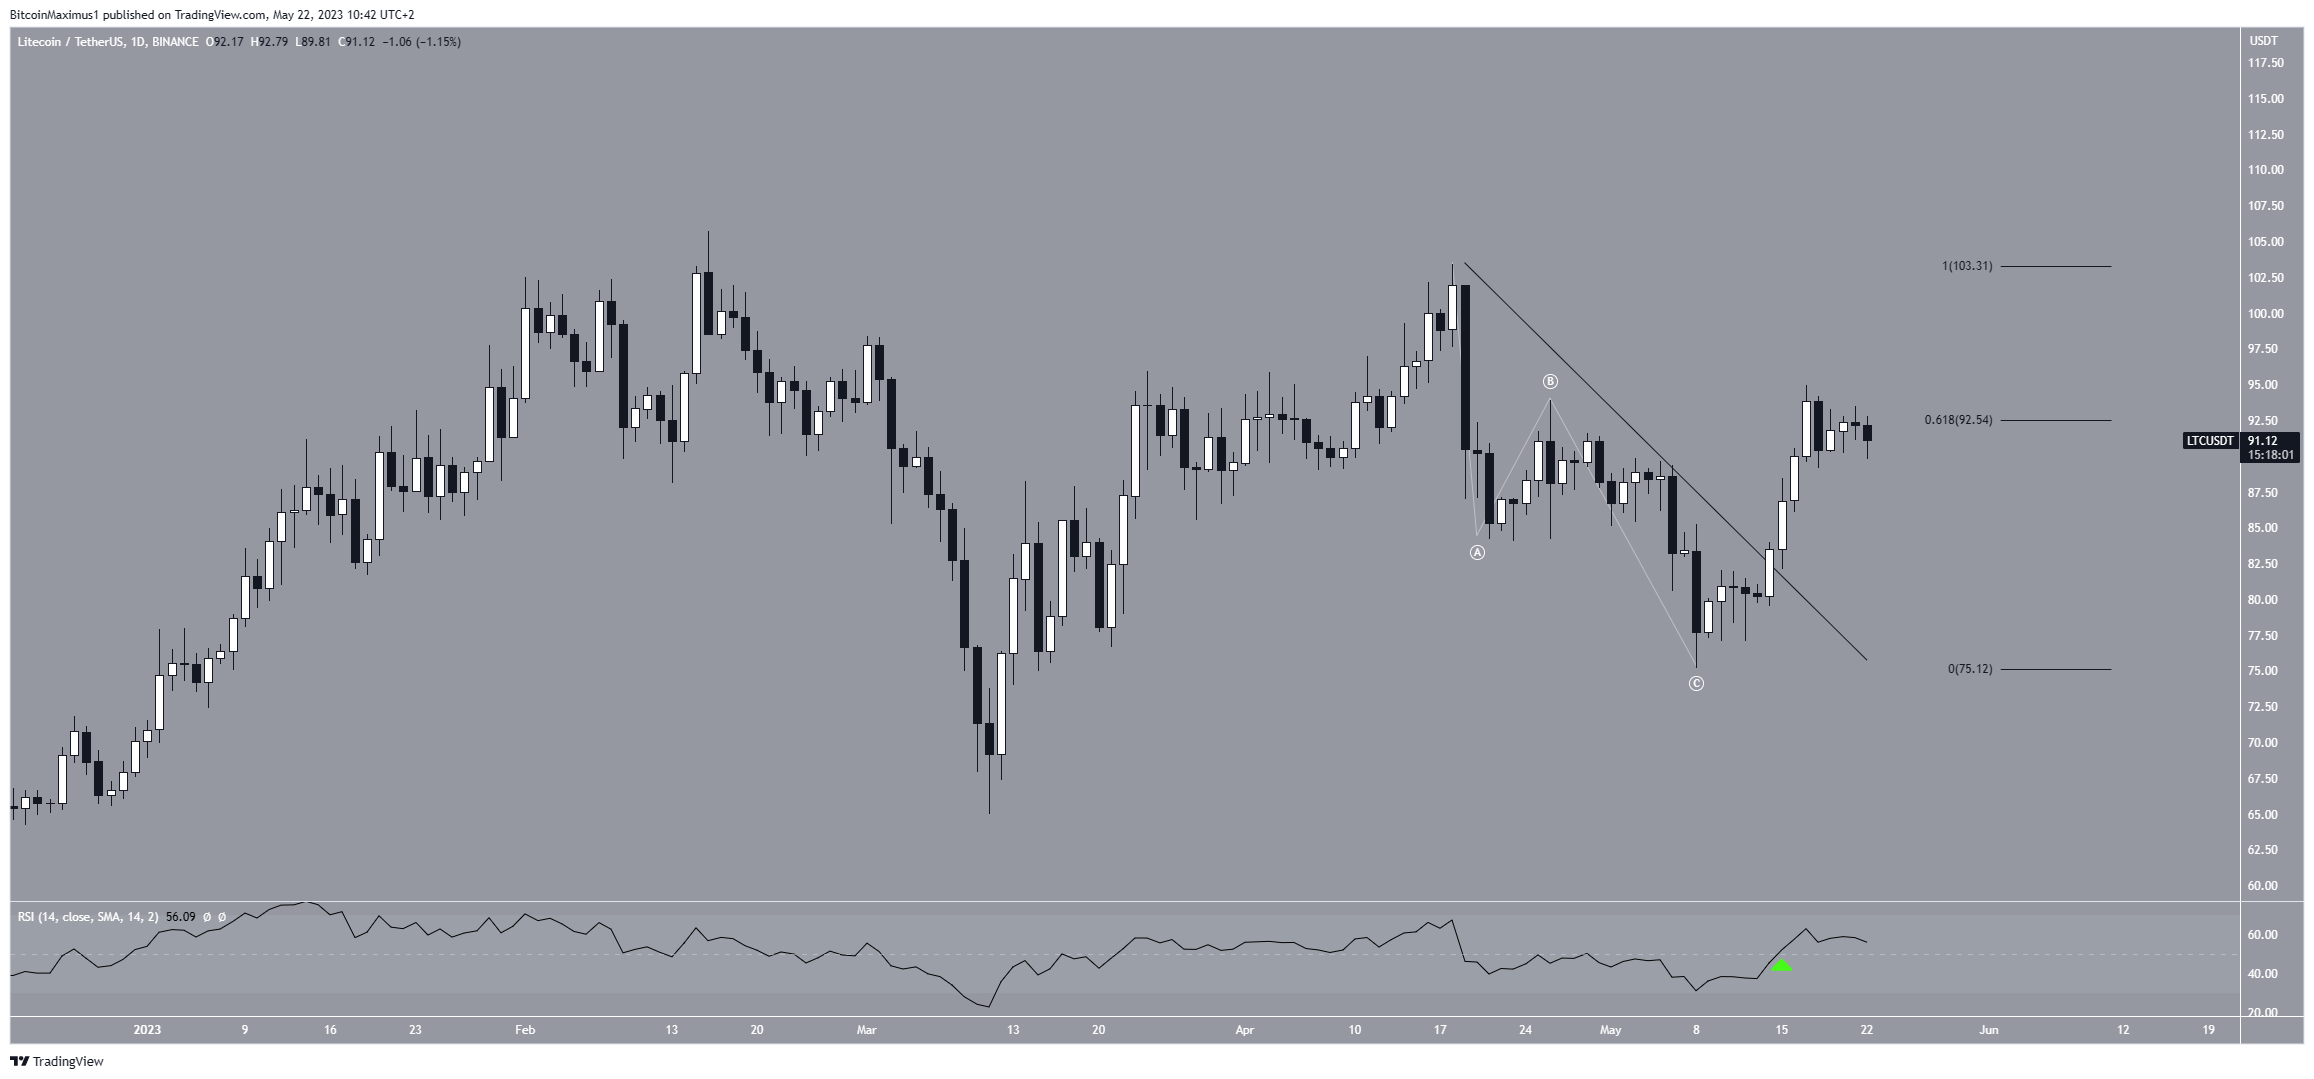
LTC/USDT Daily Chart. Source: TradingView
Finally, the RSI is bullish. The RSI is a momentum indicator used by traders to evaluate whether a market is overbought or oversold and to determine whether to accumulate or sell an asset.
Readings above 50 are considered bullish, while those below 50 are bearish. Currently, the indicator is above 50 (green icon) and increasing, a sign of a bullish trend.
The LTC price currently trades at the 0.618 Fibonacci retracement resistance level of $92.50. Whether it breaks out or gets rejected will be crucial in determining the future trend.
Litecoin (LTC) Price Prediction: Is $100 Within Reach?
In a similar fashion to the daily time frame, the six-hour wave count provides a bullish LTC price prediction.
To determine the direction of a trend, technical analysts use the Elliott Wave theory, which involves studying recurring long-term price patterns and investor psychology.
According to the wave count, the LTC price began a five-wave increase on May 9 (white). If so, it is currently in wave four, which seems to have taken the shape of a symmetrical triangle. This is the most common pattern for wave four.
If the count is correct, the LTC price will break out from the triangle and increase toward the next resistance at $99.
The resistance is created by a confluence of Fib levels, namely the 3.61 extensions of wave one (white) and the 1.61 external retracements of wave four (black).

LTC/USDT Hourly Chart. Source: TradingView
Despite this bullish LTC price prediction, a drop below the wave one high at $82 (red line) will mean that the short-term trend is also bearish.
In that case, the price can fall toward $75. This is because the Elliott Wave theory rules state that wave four cannot go into the territory of wave one.
For BeInCrypto’s latest crypto market analysis, click here


 Bitcoin
  Ethereum
  Tether
  USDC
USDC  Dogecoin
  Cardano
  Bitcoin Cash
  Polygon
  Litecoin
  LEO Token
  Hedera
  Cosmos Hub
  Stellar
  OKB
OKB  Maker
Maker  Algorand
  NEO
NEO  Gate
Gate  KuCoin
  Synthetix Network
  IOTA
IOTA  Tether Gold
  TrueUSD
  Enjin Coin
  Holo
Holo  Ravencoin
  0x Protocol
  Siacoin
  Basic Attention
  Zcash
Zcash  Decred
  Ontology
  Lisk
Lisk  Waves
Waves  DigiByte
  Numeraire
  Nano
Nano  Status
  Pax Dollar
  Steem
Steem  OMG Network
  BUSD
BUSD  Ren
Ren  Bytom
Bytom  Bitcoin Diamond
  Energi
  HUSD
HUSD  Augur
Augur