


Litecoin price analysis: LTC/USD drops to $91.84 as bears take control

The Litecoin price analysis shows that LTC/USD is trading in a bearish trend. LTC has been trading on an uptrend note before the bears took control. The bears have pushed LTC to a low of $91.84 from a high intraday of $94.43. The bearish pressure is likely to keep pushing the price down unless the buyers can push it back up.
The resistance that LTC/USD is facing is at $94.43, the high intraday level. If the buyers can break this resistance then we may see a rebound in the price of Litecoin. There is also immediate support for Litecoin at around the $90.86 mark which may provide a floor for the price. However, a break below the current support level LTC could find new support at the key support level of $90.00.
Litecoin price analysis 1-day chart: SOL steps down toward the key support level of $90.00
The daily Litecoin price analysis indicates a decreasing trend for the market as it steps down to $91.83 today. The selling pressure has been strong and the bears are pushing the price down toward the $90 mark. LTC has lost 0.76% over the past 24 hours with the trading volume decreasing to 530 million. The market capitalization is on the decrease and stands at $6.66 billion
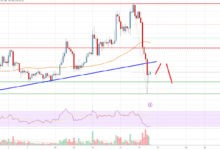
The technical outlook for Litecoin shows that further bearish pressure could push the price down if the bulls cannot break the resistance at $94.43. The Relative Strength Index (RSI) indicator has reverted and is now slopping to the south with the current value of 54.52.

LTC/USD 1-day price chart, Source: TradingView
The moving average (MA) is currently at a bearish crossover with the 50-day MA being below the 200-day MA which typically indicates that bearish momentum is dominating the market at present. The histogram in the MACD is currently heading to the red zone as the green bars are now diminishing on the chart.
Litecoin price analysis 4-hour chart: Bears are in control of LTC/USD
The hourly chart of LTC/USD shows that the price is on a downtrend as it forms lower highs and lower lows. The bears are holding firmly in control as the price is trading in the range of $90.89 to $92.50 and LTC has lost 0.76% in the past 24 hours.

LTC/USD 4-hour price chart, Source: TradingView
The Relative Strength Index has dropped at the 50 index level with a current level of 50.22 which shows that the selling pressure is strong. The MACD indicator is slightly moving to the south, as the MACD line has crossed below the signal line and is currently heading towards negative territory. On the moving average the red candlesticks are dominating the green ones on the 4-hour chart.
Litecoin price analysis conclusion
The Litecoin price analysis indicates that the bears are in control of the market as LTC/USD dropped to $91.84. The resistance is strong at $94.43 and any reversal must break this level for buyers to take over. Support for LTC can be found at the $90.86 level and a break below this could result in the price dropping to the $90.00 level.


 Bitcoin
  Ethereum
  Tether
  USDC
USDC  Dogecoin
  Cardano
  Bitcoin Cash
  Polygon
  Litecoin
  LEO Token
  Hedera
  Cosmos Hub
  Stellar
  OKB
OKB  Maker
Maker  Algorand
  NEO
NEO  Gate
Gate  KuCoin
  Synthetix Network
  IOTA
IOTA  Tether Gold
  TrueUSD
  Enjin Coin
  Holo
Holo  Ravencoin
  0x Protocol
  Siacoin
  Basic Attention
  Zcash
Zcash  Decred
  Ontology
  Lisk
Lisk  Waves
Waves  DigiByte
  Nano
Nano  Numeraire
  Status
  Pax Dollar
  Steem
Steem  OMG Network
  BUSD
BUSD  Ren
Ren  Bitcoin Diamond
  Bytom
Bytom  HUSD
HUSD  Energi
  Augur
Augur