


MATIC Technical Analysis: After a Major Downfall, Polygon Teases $1 Mark

The technical analysis exhibit that MATIC is on the way to reversal, with the 200-day SMA moving above the price line and RSI moving away from the oversold zone. Will you consider buying the MATIC? MATIC also could not prevent itself from a current crypto crash in light of the Binance-FTX deal failure and rising fear of FTX collapse. As the MATIC broke below the $1 psychological mark, it witnessed a 3.69% drop in the last 24 hours and 3.59% in the last 7 days. In the last 24 hours, the MATIC price hit as low as $0.76246131 and as high as $0.97285028. Currently trading at $0.9315 as of writing, the price action showed some recovery signs by growing 0.19% in just the past hour. The price shows the continuation of the uptrend with 200-day SMA teases at the support level showing price recovery.
Key Points
- The MATIC price action shows a bullish reversal approaching the 200-day SMA
- The bullish crossover in the MACD indicator signals a bullish breakout
- The intraday trading volume in Polygon is $1.8 billion.
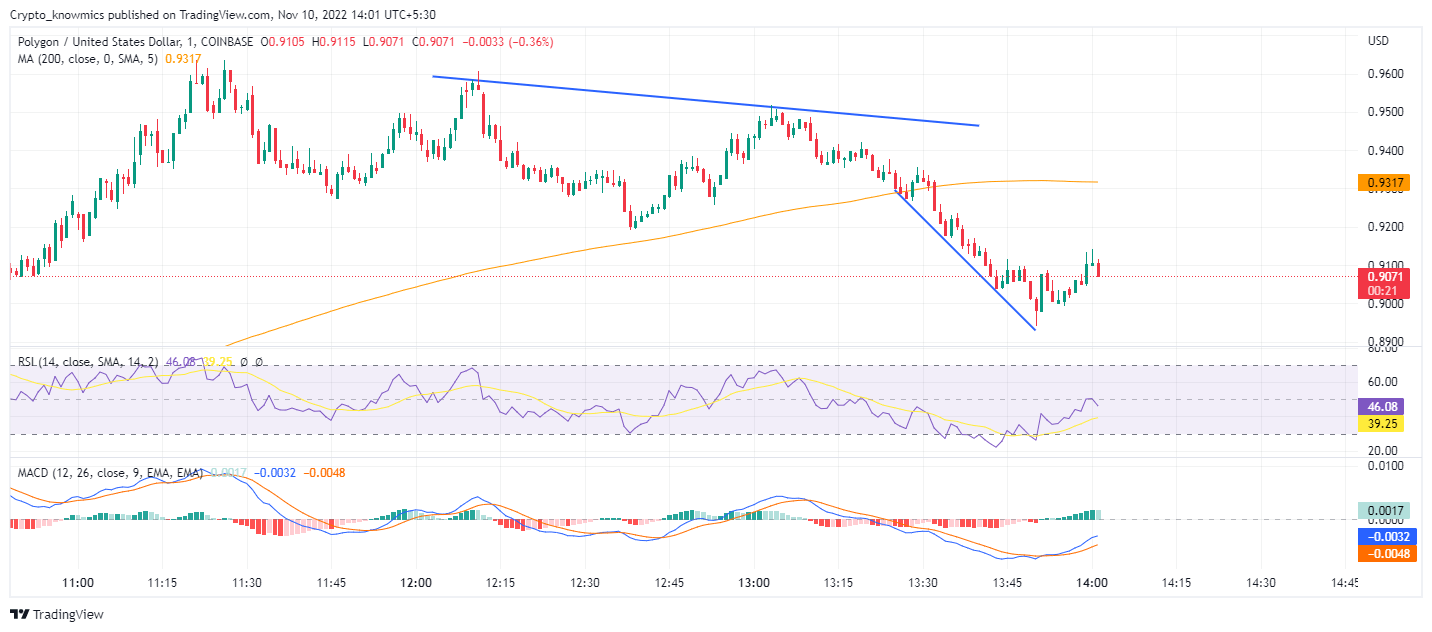
Source Tradingview
MATIC Technical Analysis
MATIC price breaks above the 50-day and 200-day SMAs approach a recovery rally teasing to reclaim the level of $1 with recent resistance fallout. With the possibility of an uptrend, traders can get multiple entry points at the current market price. The high price rejection in the daily candle showed a possibility of a bearish reversal. However, the sideline trader must wait for the daily candle to reach the $1 mark which may potentially give a bullish breakout.
Technical Indicators
RSI moves sideways in the oversold zone, making multiple bearish and bullish divergences, as it bounced back after touching the 50% level, with a 14-day SMA remaining below RSI, indicating buying opportunity. With a bullish histogram, followed by a bullish crossover the rising gap between MACD and signal lines signals an uptrend in the market, highlighting the right time to buy in the market. The technical indicators display buying pressure due to recovery in the MATIC as 200-day SMA indicates an uptrend, providing traders with multiple buying opportunities with every fallout.


 Bitcoin
  Ethereum
  Tether
  USDC
USDC  Dogecoin
  Cardano
  Bitcoin Cash
  Polygon
  Litecoin
  LEO Token
  Hedera
  Stellar
  Cosmos Hub
  OKB
OKB  Maker
Maker  Algorand
  NEO
NEO  Gate
Gate  KuCoin
  Synthetix Network
  IOTA
IOTA  Tether Gold
  TrueUSD
  Holo
Holo  Enjin Coin
  0x Protocol
  Ravencoin
  Siacoin
  Basic Attention
  Ontology
  Zcash
Zcash  Decred
  Waves
Waves  Lisk
Lisk  DigiByte
  Nano
Nano  Status
  Pax Dollar
  Numeraire
  Steem
Steem  OMG Network
  BUSD
BUSD  Ren
Ren  Bytom
Bytom  Bitcoin Diamond
  HUSD
HUSD  Energi
  Augur
Augur