


May Forecast for Shiba Inu (SHIB) Price: Hold or Sell?

The Shiba Inu (SHIB) price has nearly reached the support line of a long-term pattern. Whether it bounces there or breaks down can be crucial for the future trend.
A breakdown will mean that the entire structure in place for nearly a year is now invalid, and a new bearish trend has begun. On the other hand, a bounce will likely lead to continued consolidation inside the pattern.
Shiba Inu Price Reaches Support of Long-Term Pattern
Based on the daily analysis, the price of the Shiba Inu coin has been trading within a symmetrical triangle since June 2022. This pattern is considered neutral, which means there’s an equal likelihood of an upward breakout or a downward breakdown.
Currently, the SHIB price is positioned very close to the triangle’s support line, which has not been reached since the beginning of the year (green icon).
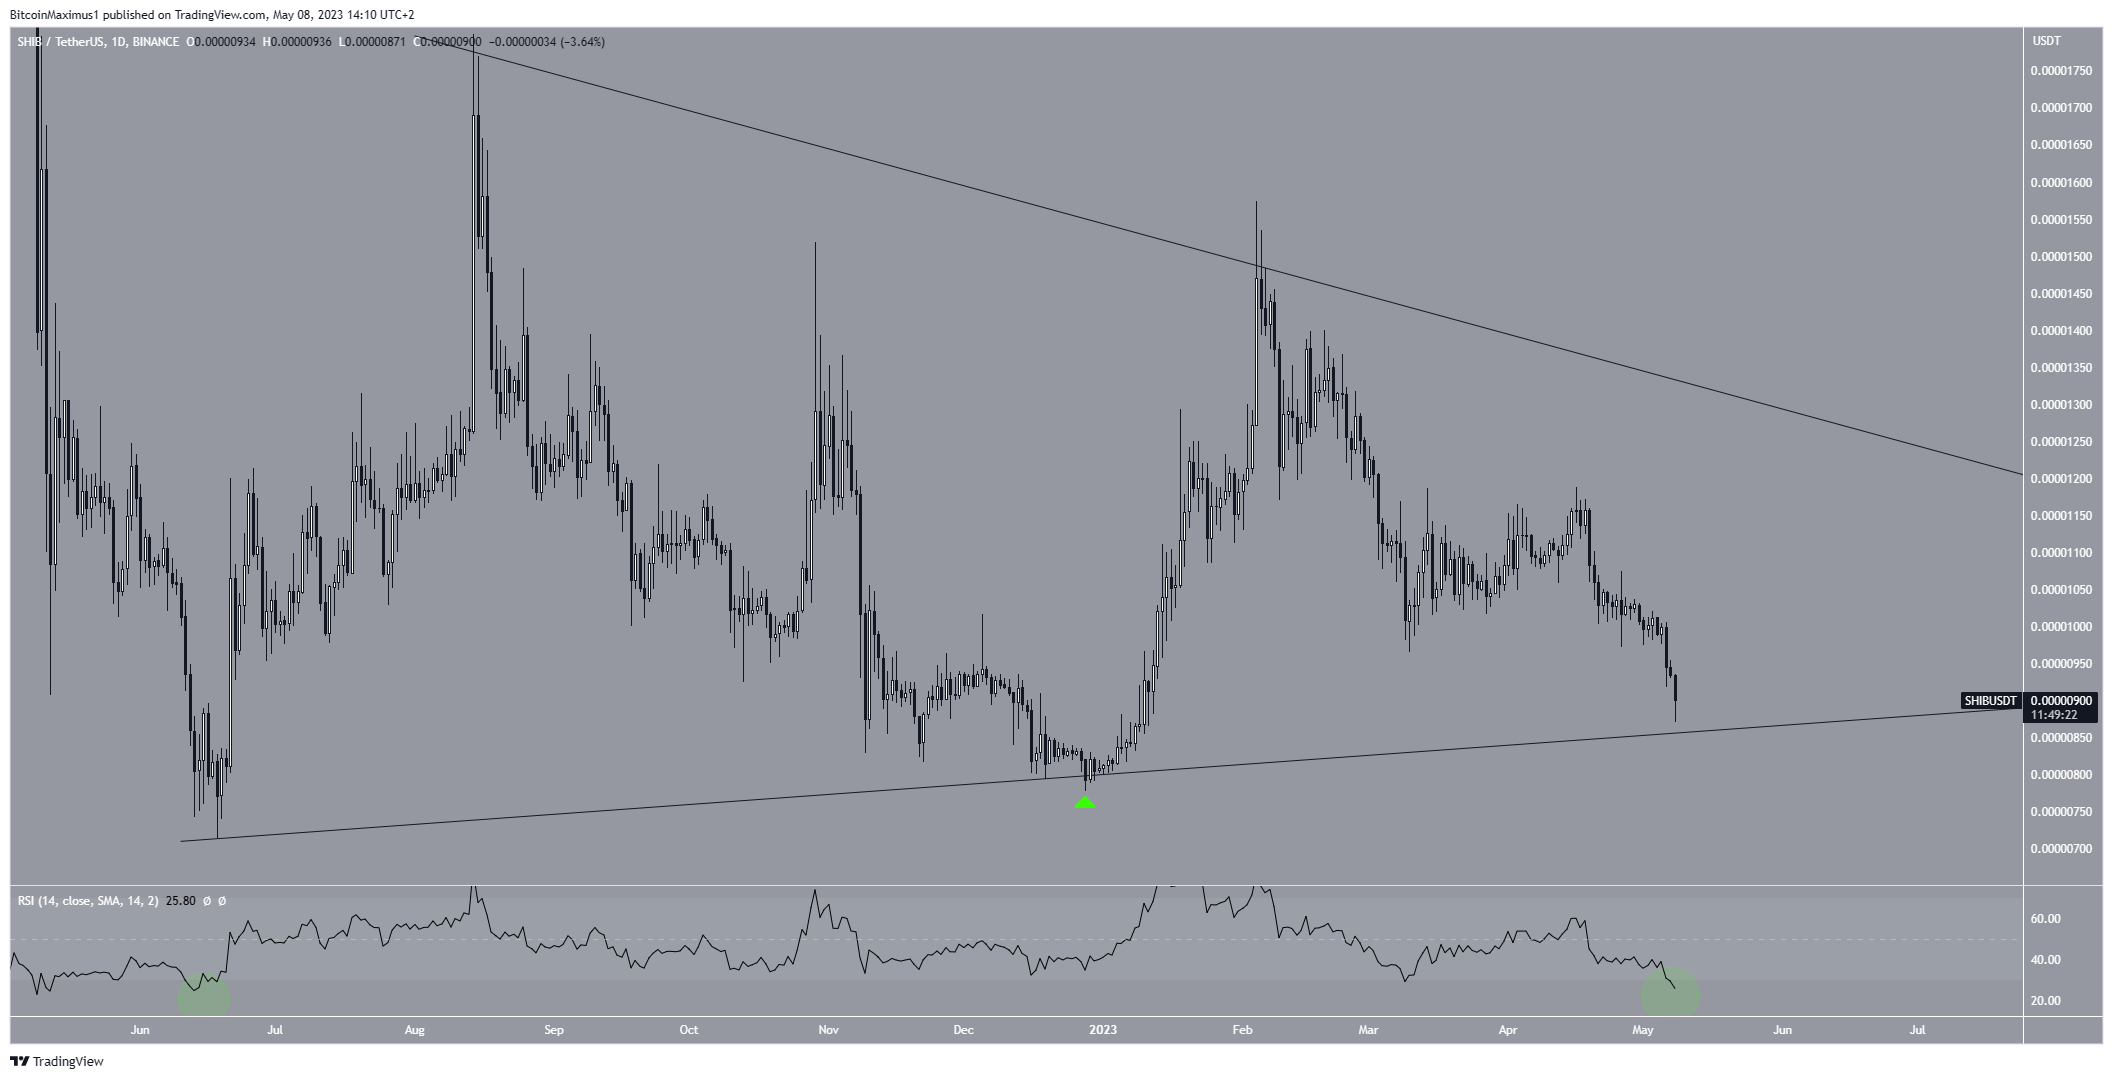
SHIB/USDT Daily Chart. Source: TradingView
The daily Relative Strength Index (RSI) provides conflicting readings. Traders use the RSI to gauge momentum, determine if a market is overbought or oversold, and make decisions about buying or selling an asset.
If the RSI reading is above 50 and the trend is upward, bulls have an advantage. On the other hand, if the reading is below 50, the opposite is true.
The RSI is currently below 50 and decreasing. However, it has also reached oversold territory. A significant upward movement followed the last time it was this oversold (green circle).
SHIB Price Prediction: Will Price Bounce
The technical analysis from the short-term six-hour time frame shows that the meme coin price has fallen inside a descending parallel channel since April 16. These channels are considered bullish structures, meaning that they lead to breakouts most of the time.
The price of Shiba bounced at the pattern’s support line today, creating a long lower wick (green icon). However, it is still trading in its lower portion.
Similarly to the daily time frame, the six-hour RSI is extremely oversold, which could lead to an upward movement soon.
So, a bounce at the channel’s support line would also validate the support line of the long-term triangle. A breakout from the former will likely cause an upward movement toward the long-term triangle’s resistance line at an average price of $0.0000130.

SHIB/USDT Six-Hour Chart. Source: TradingView
However, a price breakdown below the triangles support line can lead to a sharp fall toward the next closest support area at $0.0000057. Which has not been reached since June 2021.
For BeInCrypto’s latest crypto market analysis, click here


 Bitcoin
  Ethereum
  Tether
  USDC
USDC  Dogecoin
  Cardano
  Bitcoin Cash
  Polygon
  Litecoin
  LEO Token
  Hedera
  Cosmos Hub
  Stellar
  OKB
OKB  Maker
Maker  Algorand
  NEO
NEO  Gate
Gate  KuCoin
  Synthetix Network
  IOTA
IOTA  Tether Gold
  TrueUSD
  Enjin Coin
  Holo
Holo  Ravencoin
  0x Protocol
  Siacoin
  Basic Attention
  Zcash
Zcash  Decred
  Ontology
  Lisk
Lisk  Waves
Waves  DigiByte
  Numeraire
  Nano
Nano  Status
  Pax Dollar
  Steem
Steem  OMG Network
  BUSD
BUSD  Ren
Ren  Bitcoin Diamond
  Bytom
Bytom  Energi
  HUSD
HUSD  Augur
Augur