Polkadot Falls Significantly And Approaches $4.00 Low

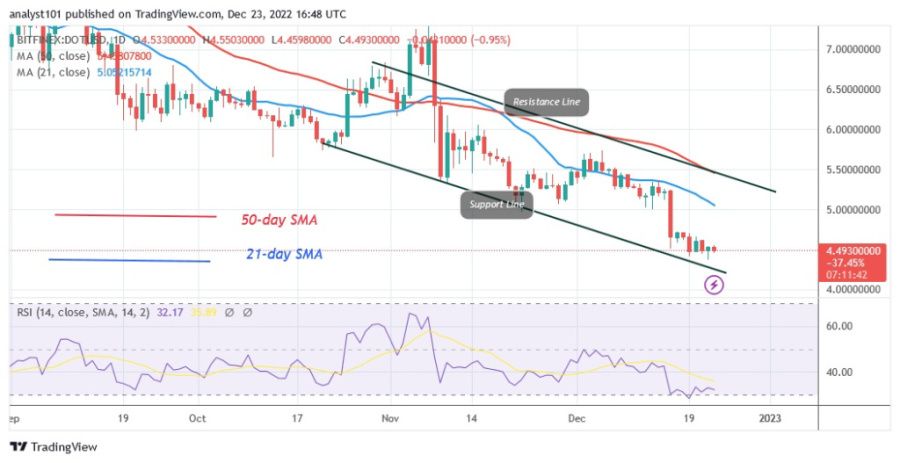
Polkadot (DOT) is falling after rejecting the $5.25 resistance on the 21-day line SMA.
Polkadot price long-term analysis: bearish
Since December 19, the cryptocurrency has consolidated above the $4.40 support level. Selling pressure has eased as the altcoin consolidates above its current support level. If the bears break the $4.40 support level, Polkadot will fall to a low of $4.00. The downtrend could reverse if the price rises above $4.00. The market will resume its movement between $4.00 and $5.50, where the current support is located.
Polkadot indicator analysis
Since December 19, Polkadot has been at level 28 on the Relative Strength Index for period 14. The altcoin has been consolidating as it trades in the oversold region of the market. The price bars are below the moving average line, which makes it vulnerable to a decline. The 21-day and 50-day SMAs are pointing south, indicating a downtrend.

Technical indicators
Key resistance levels — $10 and $12
Key support levels — $6 and $4
What is the next direction for Polkadot?
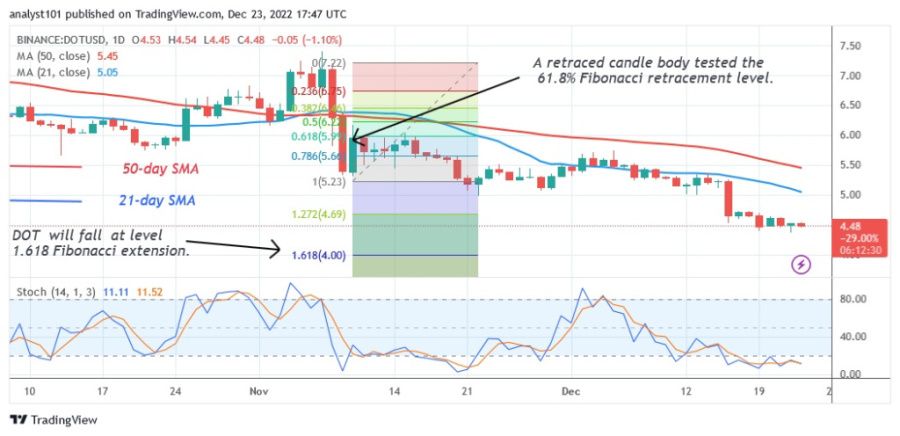
Polkadot has fallen significantly and may continue to fall. On November 9, the downtrend and a candlestick tested the 61.8% Fibonacci retracement level. After the correction, DOT will fall to the 1.618 Fibonacci extension level or $4.00.

Disclaimer. This analysis and forecast are the personal opinions of the author and are not a recommendation to buy or sell cryptocurrency and should not be viewed as an endorsement by CoinIdol. Readers should do their research before investing in funds.


 Bitcoin
  Ethereum
  Tether
  USDC
USDC  TRON
TRON  Dogecoin
  Cardano
  Monero
  Bitcoin Cash
  Chainlink
  LEO Token
  Stellar
  Zcash
Zcash  Litecoin
  Hedera
  Dai
Dai  Cronos
  OKB
OKB  Tether Gold
  Ethereum Classic
  KuCoin
  Cosmos Hub
  Algorand
  Gate
Gate  VeChain
  Dash
Dash  Stacks
  Tezos
Tezos  TrueUSD
  IOTA
IOTA  Decred
  Theta Network
  Basic Attention
  NEO
NEO  Synthetix
  Qtum
Qtum  Ravencoin
  0x Protocol
  Zilliqa
  DigiByte
  Nano
Nano  Siacoin
  Numeraire
  Waves
Waves  Ontology
  Enjin Coin
  Status
  Hive
Hive  BUSD
BUSD  Lisk
Lisk  Pax Dollar
  Steem
Steem  Huobi
Huobi  OMG Network
  Bitcoin Gold
  NEM
NEM  Augur
Augur  Bitcoin Diamond