


TON, XDC, OKB, BSV, LDO Lead the Way in Crypto Market Bounce

BeInCrypto looks at five altcoins that increased the most from the entire crypto market last week, specifically from Dec. 9 – 16.
These digital assets have taken the crypto news and crypto market spotlight:
- Toncoin (TON) price increased by 30.29%
- XDC Network (XDC) price increased by 12.49%
- OKB (OKB) price increased by 12.25%
- Bitcoin SV (BSV) price increased by 11.55%
- Lido DAO (LDO) price increased by 9.49%
TON Leads Altcoin Gainers
From the five altcoins that increased the most last week, TON increased more than double that of the second-place altcoin.
The TON price has increased since Oct. 13 in what is likely a five-wave upward movement (black). If correct, the price is in wave three. The sub-wave count is given in white, indicating that the TON price is in sub-wave four.
The most likely target for the local top is at $3.43, created by the 2.61 external Fib retracement of wave two.
A decrease below the wave one high (red line) of $1.99 would invalidate this bullish hypothesis.
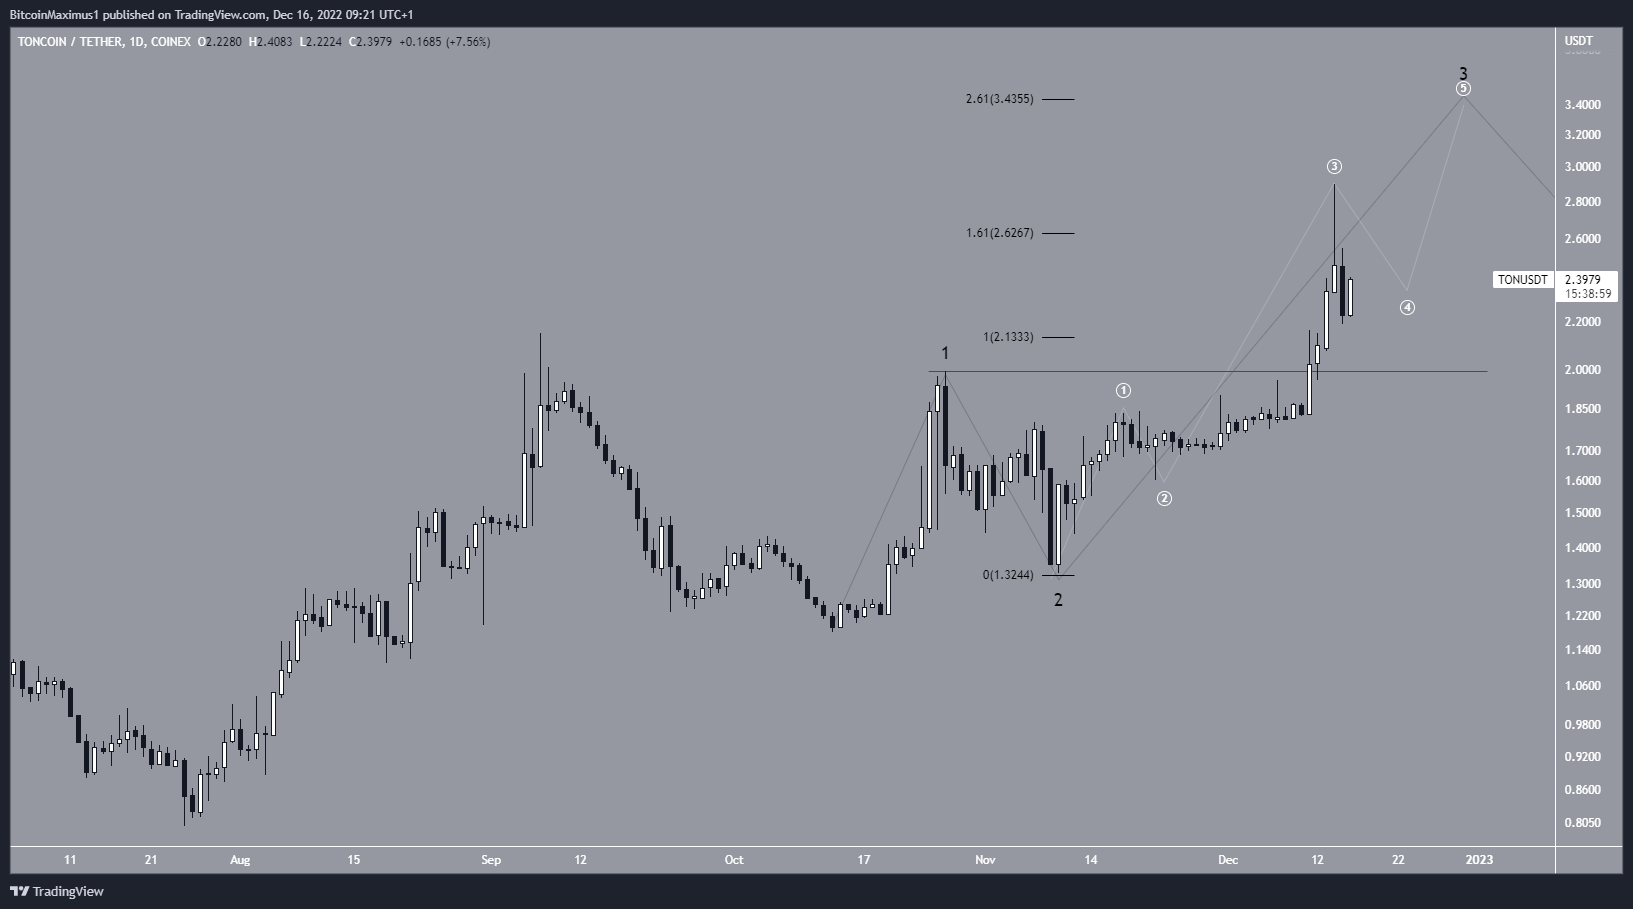
TON/USDT Daily Chart. Source: TradingView
XDC Approaches Crucial Resistance
XDC has decreased below a descending resistance line since Aug. 11. The downward movement led to a low of $0.018 on Dec. 7. The price has been moving upward since and is approaching the descending resistance line.
Currently, the line also coincides with the $0.026 resistance area, increasing its significance.
If the XDC price fails to break out, it could fall toward the yearly lows at $0.018. On the other hand, a breakout could accelerate the rate of increase toward $0.032.
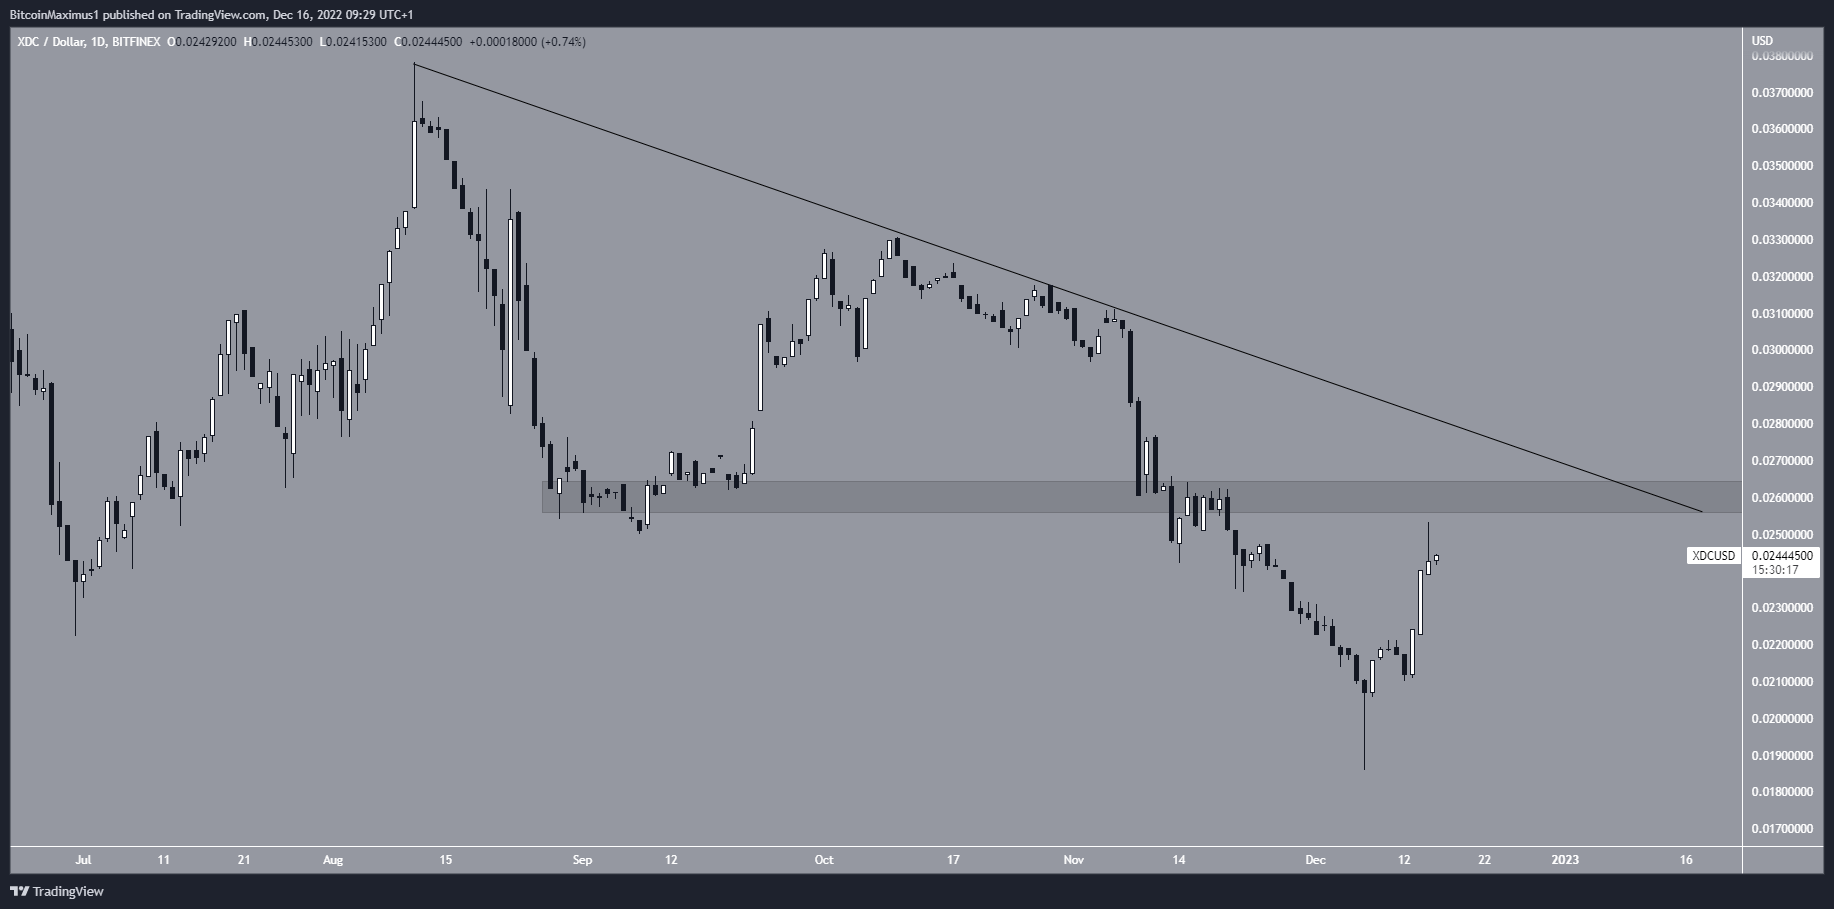
XDC/USD Daily Chart. Source: TradingView
Will OKB Reaches Highest Price Since March
Out of the five altcoins analyzed, OKB is the one that has increased the most relative to its yearly lows. OKB price has been moving upward since June. After three unsuccessful attempts (red icons), it broke out above the $22.50 resistance area on Dec. 13. It has been increasing since and reached a high of $24.60 on Dec. 16. This is the highest price since March 2022.
If the upward movement continues, the next resistance would be at $32.30. Conversely, a daily close below $22.50 would indicate that the trend is bearish.
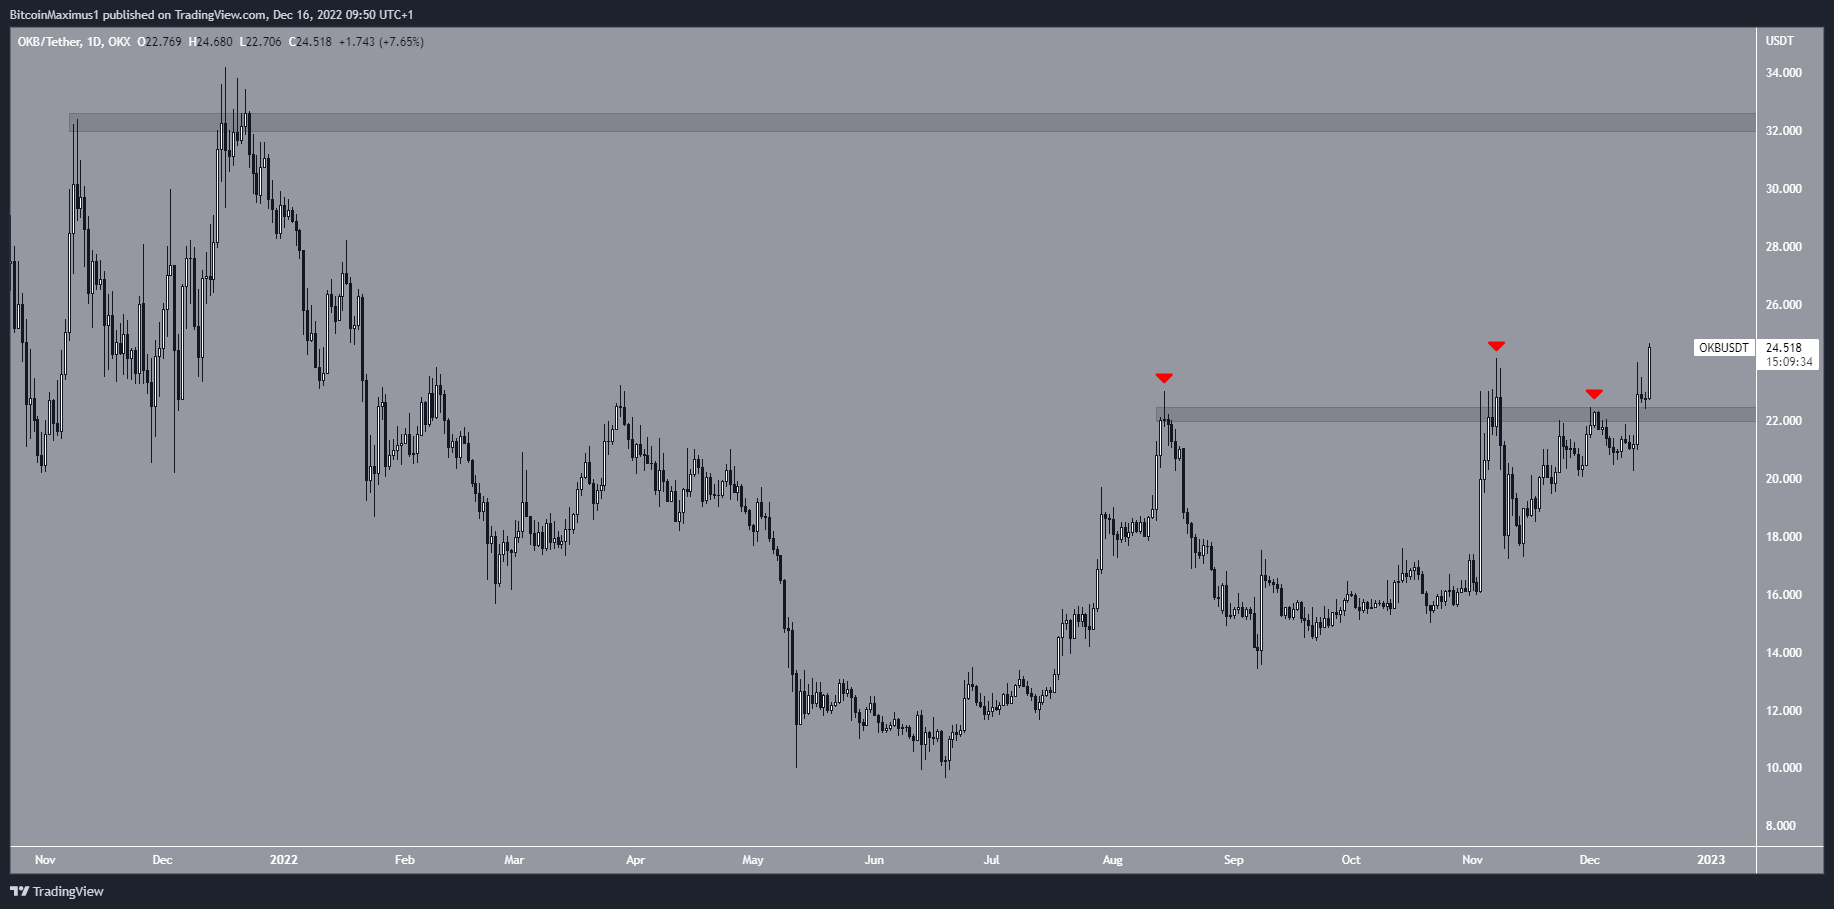
OKB/USDT Daily Chart. Source: TradingView
BSV Makes Breakout Attempt
The BSV price has increased alongside an ascending support line since Nov. 9. The upward movement led to a high of $48 on Dec. 12.
The BSV price fell sharply afterward, but created a long lower wick, validating the ascending support line. It made another attempt at breaking out above the $48 resistance area on Dec. 16.
Reaching a daily close above the $48 resistance area would be a decisive bullish sign, while a rejection could cause a drop toward the ascending support line at $43.

BSV/USDT Six-Hour Chart. Source: TradingView
LDO Continues Range Consolidation
The LDO price has been moving upward since Nov. 9, when it validated the descending resistance line from which it previously broke out.
However, the upward movement has been very gradual. LDO is stuck in a range between $0.93 and $1.28. A breakout above the top of the range could catalyze an upward movement toward $1.80. On the other hand, a breakdown could initiate a fall toward $0.40.

LDO/USDT Daily Chart. Source: TradingView

 Bitcoin
  Ethereum
  Tether
  USDC
USDC  Dogecoin
  Cardano
  Bitcoin Cash
  Polygon
  Litecoin
  LEO Token
  Hedera
  Cosmos Hub
  Stellar
  OKB
OKB  Maker
Maker  Algorand
  NEO
NEO  Gate
Gate  KuCoin
  Synthetix Network
  IOTA
IOTA  Tether Gold
  TrueUSD
  Enjin Coin
  Holo
Holo  Ravencoin
  0x Protocol
  Siacoin
  Basic Attention
  Zcash
Zcash  Decred
  Ontology
  Lisk
Lisk  Waves
Waves  DigiByte
  Nano
Nano  Numeraire
  Status
  Pax Dollar
  Steem
Steem  OMG Network
  BUSD
BUSD  Ren
Ren  Bitcoin Diamond
  Bytom
Bytom  HUSD
HUSD  Energi
  Augur
Augur