


Polygon (MATIC) Price: Future Implications of Long-Term Breakdown

The Polygon (MATIC) price has moved below the support line of a long-term structure, a sign that the long-term upward movement might have ended.
In addition to this long-term breakdown, the daily time frame supports the continuation of the decrease since it has created a bearish pattern. As a result, the decrease may continue in both the short- and the long-term.
Polygon Price Closes Below Bullish Structures
Based on technical analysis of the long-term weekly timeframe, the outlook for MATIC, the native token of Polygon network, is bearish for several reasons.
Firstly, the price of the MATIC token has broken down from an ascending parallel channel, a pattern that is considered bearish. Since the pattern had been in place since the beginning of the year, a breakdown is a sign that more downside is expected.

MATIC/USDT Weekly Chart. Source: TradingView
Secondly, the weekly Relative Strength Index (RSI) is bearish. Traders use the RSI as a momentum indicator to decide whether to buy or sell an asset. Bulls have an advantage if the RSI reading is above 50 and the trend is upward, but if the reading is below 50, the opposite is true.
In the case of the Polygon price, the RSI has decreased below 50 (red icon), indicating a bearish trend. The RSI decrease coinciding with a price decrease legitimizes the latter.
The closest support level is at $0.76 while the closest resistance is at the channel’s midline at $1.40.
MATIC Price Prediction: Is More Downside Expected?
The analysis of Polygon’s price on both daily and weekly time frames agrees. Although the price initially bounced off the horizontal support area at $0.95, it is now in the process of breaking down.
Also, it is still following a short-term descending resistance line. These two factors have created a descending triangle, which is generally considered a bearish pattern.
Therefore, a breakdown from this pattern is the most probable scenario, which may lead to a downward movement toward the next support at $0.76.
Next, if the price does not bounce today, the daily close will be the lowest since Jan. 16 (red icon). Finally, the daily RSI reading supports this probability. The momentum indicator is below 50 and decreasing, a sign of a bearish trend.
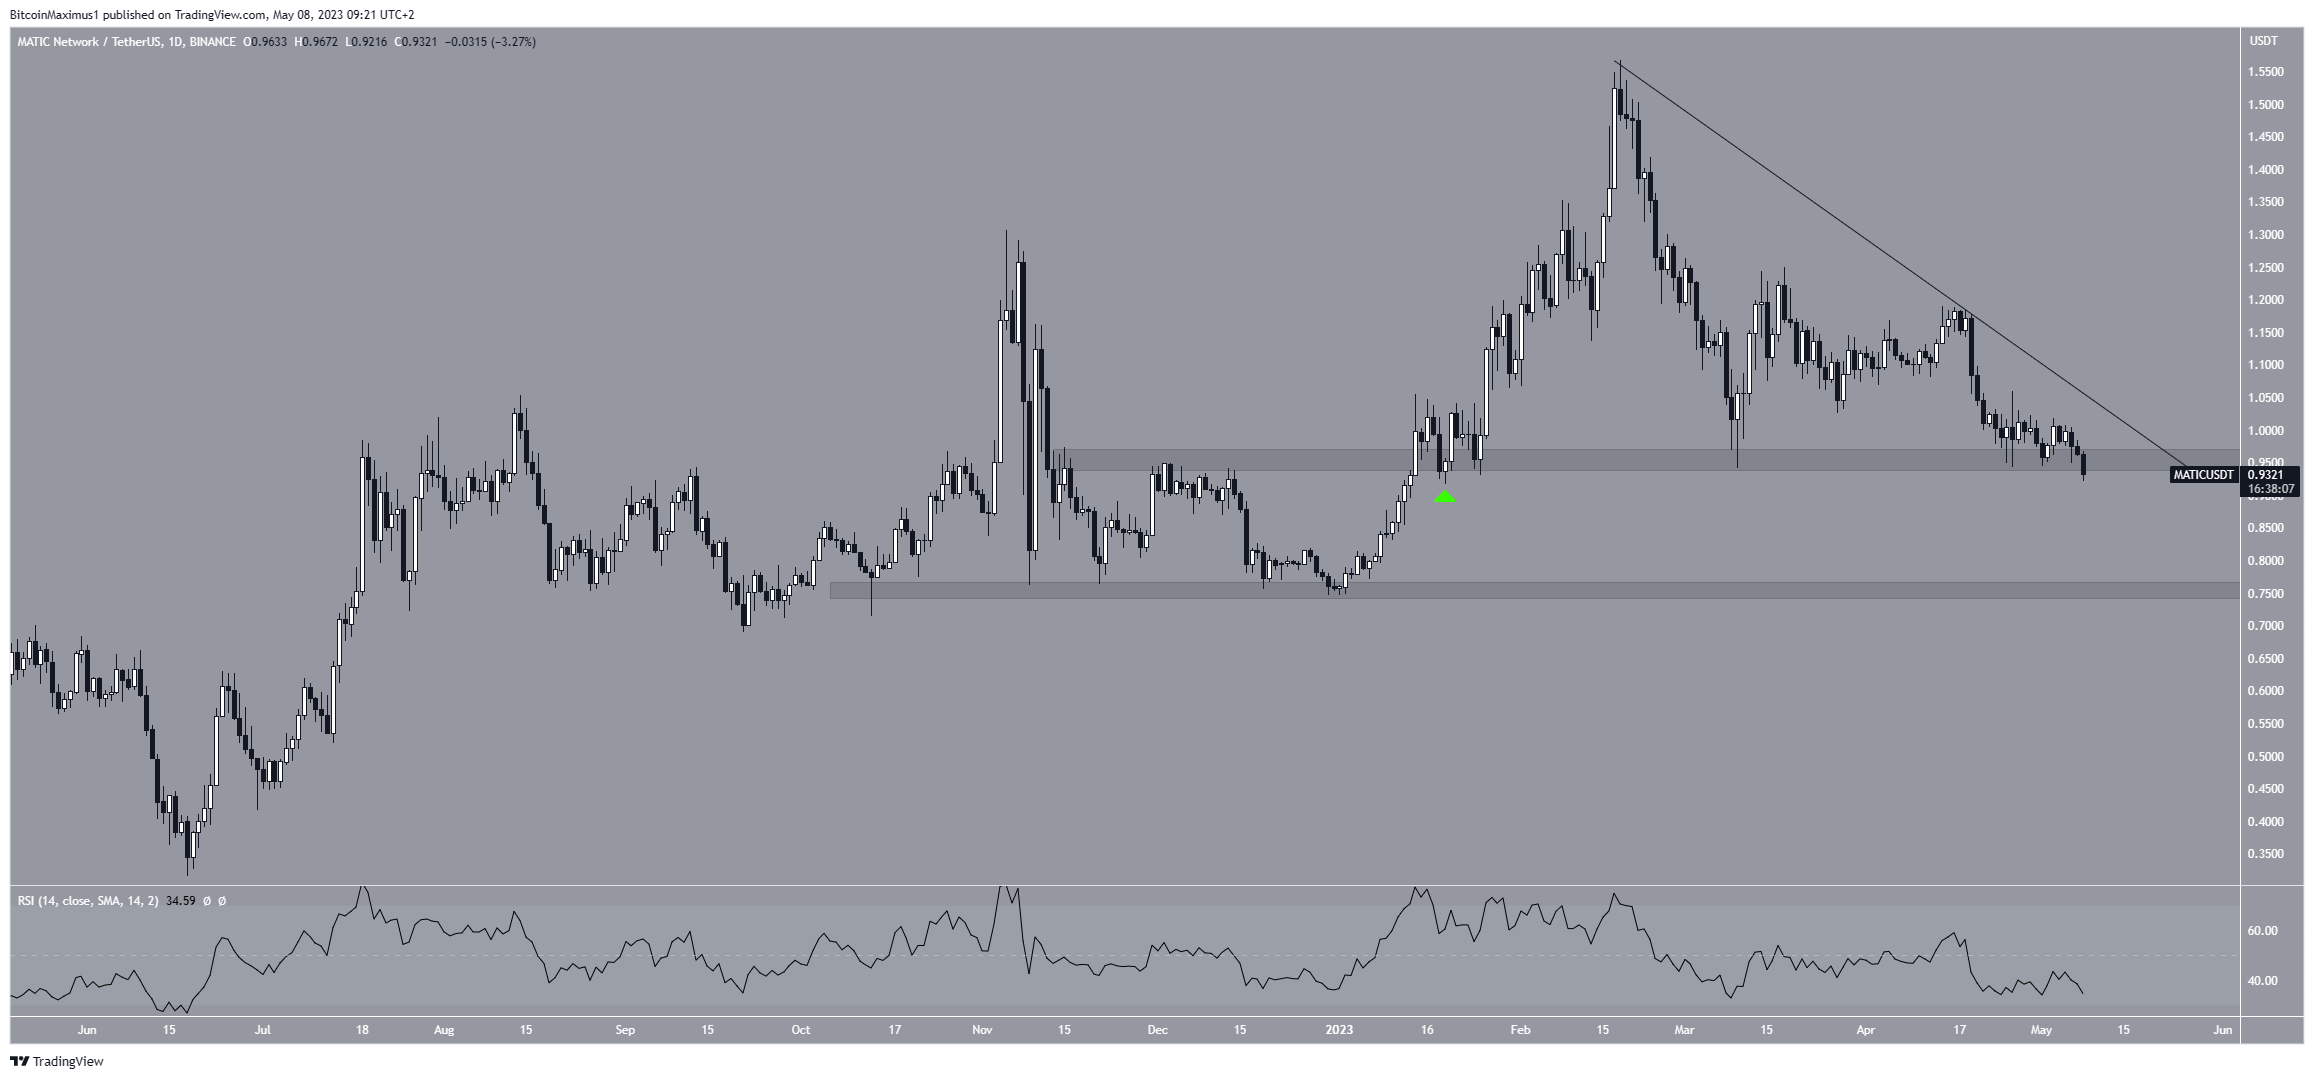
MATIC/USDT Daily Chart. Source: TradingView
Despite the bearish MATIC price prediction, moving above the resistance line and reclaiming the previous channel’s support line will mean the trend is bullish.
In that case, the future price can move toward the channel’s midline at $1.40.
For BeInCrypto’s latest crypto market analysis, click here.


 Bitcoin
  Ethereum
  Tether
  USDC
USDC  Dogecoin
  Cardano
  Bitcoin Cash
  Polygon
  Litecoin
  LEO Token
  Hedera
  Cosmos Hub
  Stellar
  OKB
OKB  Maker
Maker  Algorand
  Gate
Gate  NEO
NEO  KuCoin
  Synthetix Network
  IOTA
IOTA  Tether Gold
  TrueUSD
  Enjin Coin
  Siacoin
  Holo
Holo  0x Protocol
  Ravencoin
  Zcash
Zcash  Basic Attention
  Decred
  Lisk
Lisk  Ontology
  Waves
Waves  DigiByte
  Numeraire
  Pax Dollar
  Nano
Nano  Status
  Steem
Steem  OMG Network
  BUSD
BUSD  Ren
Ren  Bytom
Bytom  Bitcoin Diamond
  HUSD
HUSD  Augur
Augur  Energi