


Positive Ripple Trend Interrupted by Second Red Weekly Close (XRP Price Analysis)
Markets are waiting for the arrival of the FOMC meeting, which has been creating uncertainty. Last night, XRP closed its second consecutive weekly red candle. This put the rising trend that began in mid-November on the edge of reversal.
Technical Analysis
By Grizzly
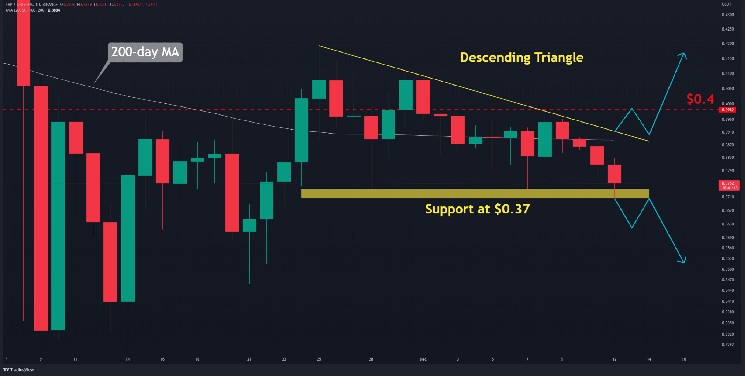
The Daily Chart
Ripple is trading below the 200-day moving average line (in white) on the daily chart and is expected to close a third consecutive candle below it.
The descending triangle (in yellow), technically a bearish pattern, has resulted in lower highs, indicating that sellers have the upper hand in influencing market outcomes. Short setups can be triggered if the price slips below the horizontal support at $0.37. The initial short-term support in this scenario is found at $0.35.
A breakout from above and a $0.4 flip, on the other hand, would be bullish. The cryptocurrency would likely retest $0.42 in this scenario.
Leaving this level behind will pave the way for a bullish rally on the daily chart. A move of this magnitude would have a target of roughly $0.5.
Moving Averages:
MA20: $0.39
MA50: $0.41
MA100: $0.42
MA200: $0.39

The XRP/BTC Chart
Against Bitcoin, the price is poised to close its second candlestick below the 100-day moving average line (in white), which has been unprecedented in recent months.
Currently, the most critical support is at 2200 SATs (in yellow). If it cracks, selling pressure can escalate, perhaps forcing the pair to retest 2000 SATs (in green).
The September uptrend, on the other hand, can restart only if the price can surpass 2500 SATs (in red).
Key Support Levels: 2000 SATS, 1800 SATs
Key Resistance Levels: 2500 SATs, 2900 SATs


 Bitcoin
  Ethereum
  Tether
  USDC
USDC  Dogecoin
  Cardano
  Bitcoin Cash
  Polygon
  Litecoin
  LEO Token
  Hedera
  Cosmos Hub
  Stellar
  OKB
OKB  Maker
Maker  Algorand
  NEO
NEO  Gate
Gate  KuCoin
  Synthetix Network
  IOTA
IOTA  Tether Gold
  TrueUSD
  Enjin Coin
  Holo
Holo  Ravencoin
  0x Protocol
  Siacoin
  Basic Attention
  Zcash
Zcash  Decred
  Ontology
  Lisk
Lisk  Waves
Waves  DigiByte
  Nano
Nano  Status
  Numeraire
  Pax Dollar
  Steem
Steem  OMG Network
  BUSD
BUSD  Ren
Ren  Bytom
Bytom  Bitcoin Diamond
  Energi
  HUSD
HUSD  Augur
Augur