


QNT Technical Analysis: Will Quant Maintain Recent Rebound Above $120?

The QNT technical analysis highlights an inclining trend backed by a recent bull run, taking prices above $120 with substantial demand in the market providing opportunities for traders. Despite falling below the psychologically important mark of $100 last fortnight, the Quant (QNT) made an impressive recovery by delivering a growth of 7.1% in the last 14 days. Currently trading at $122.08, QNT price action has shown strong bullish momentum after breaking above the mark of $120. With the market cap surging by 9.57% to $1.44 billion, QNT saw a jump of 5.12% during the last 24 hours. Additionally the spike of 19.14% to $34.08 million, the trading volume also reflects the dominance of buyers in the market.
Key Points
- The QNT price action display bullish momentum with low-price rejection candles
- Moving above 200-day EMA the daily chart shows a steep uptrend
- The intraday trading volume in QNT is $34.08 million, reflecting a rise of 19.14%
Source Tradingview
QNT Technical Analysis
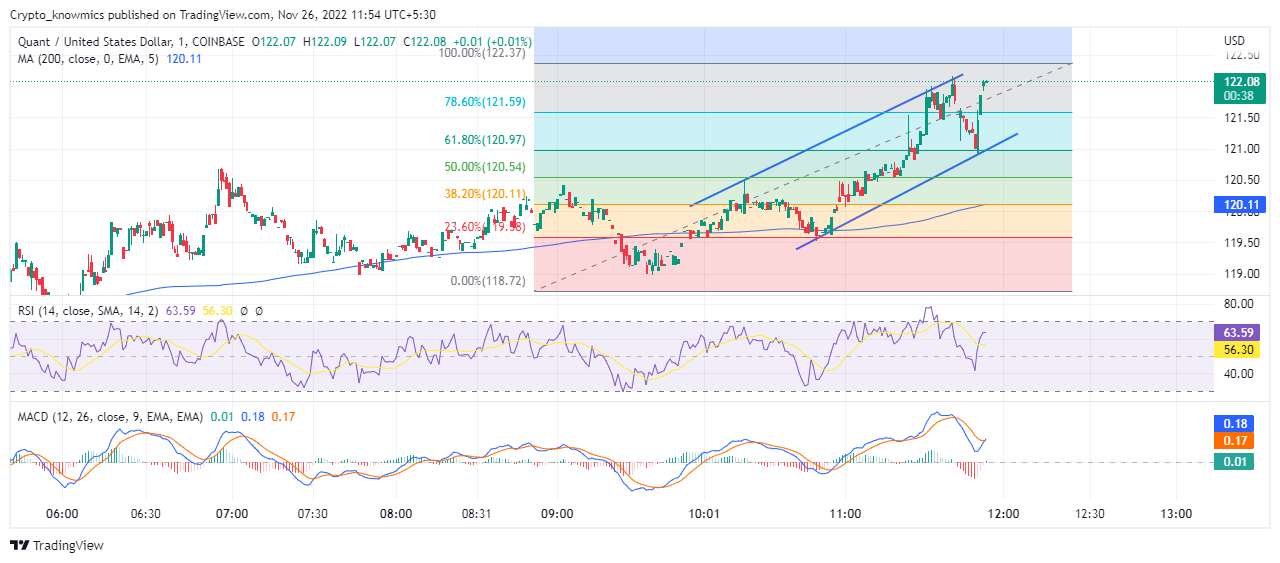
In the previous analysis, QNT displayed a sharp rebound after falling to the low of $108.28. But, prices could not maintain the momentum and fell below the support level of $100. However, of late, the QNT has been able to trigger another round of rebound as today’s trading chart also represents a continuation of the bullish rally. After consolidating below $120 the QNT price action showed a remarkable recovery. Following the recent drop, prices pulled back at the mark of $119 after facing opposition from the 200-day EMA and broke above the $120 mark. The sideline trades may expect buying opportunities if prices continue to stay above $122. If QNT sustains the bull run it may dare to break out above $125. Conversely, if QNT witnesses bullish failure it may drop again below $120.
Technical Indicators
A sharp upward movement of RSI above the level of 60, challenging the 14-day SMA while making a bullish divergence, projects a considerable amount of demand for QNT in the market. MACD also teases a bullish crossover as bullish bars reappear on the histogram. Supported by the high demand in the market with MACD signaling another upswing, the technical indicator underlines the right time for traders to make an option.


 Bitcoin
  Ethereum
  Tether
  USDC
USDC  Dogecoin
  Cardano
  Bitcoin Cash
  Polygon
  Litecoin
  LEO Token
  Hedera
  Cosmos Hub
  Stellar
  OKB
OKB  Maker
Maker  Algorand
  Gate
Gate  NEO
NEO  KuCoin
  Synthetix Network
  IOTA
IOTA  Tether Gold
  TrueUSD
  Enjin Coin
  Siacoin
  Holo
Holo  0x Protocol
  Ravencoin
  Basic Attention
  Zcash
Zcash  Decred
  Lisk
Lisk  Ontology
  Waves
Waves  DigiByte
  Numeraire
  Pax Dollar
  Nano
Nano  Status
  Steem
Steem  OMG Network
  BUSD
BUSD  Ren
Ren  Bytom
Bytom  Bitcoin Diamond
  Augur
Augur  Energi
  HUSD
HUSD