


RVN Technical Analysis: Bullish Trend in Ravencoin Eyes $0.15

RVN price chart shows an inverted head and shoulder possibility, which may push the Ravencoin market value above the $0.1 mark. The bullish reversal rally exceeded the psychological mark of $0.050 and approached the overhead supply zone at $0.075. However, the selling pressure growing at the supply zone teases a bearish turnaround. Nonetheless, the growing underlying bullishness teases an inverted head and shoulder possibility if the reverting prices take support at the $0.050 mark.
Key Points:
- The Ravencoin price action shows an increased selling spree at $0.075.
- The bullish crossover of the 50 and 100-day EMA reflects solid underlying bullishness.
- The intraday trading volume in Ravencoin is $475 million.
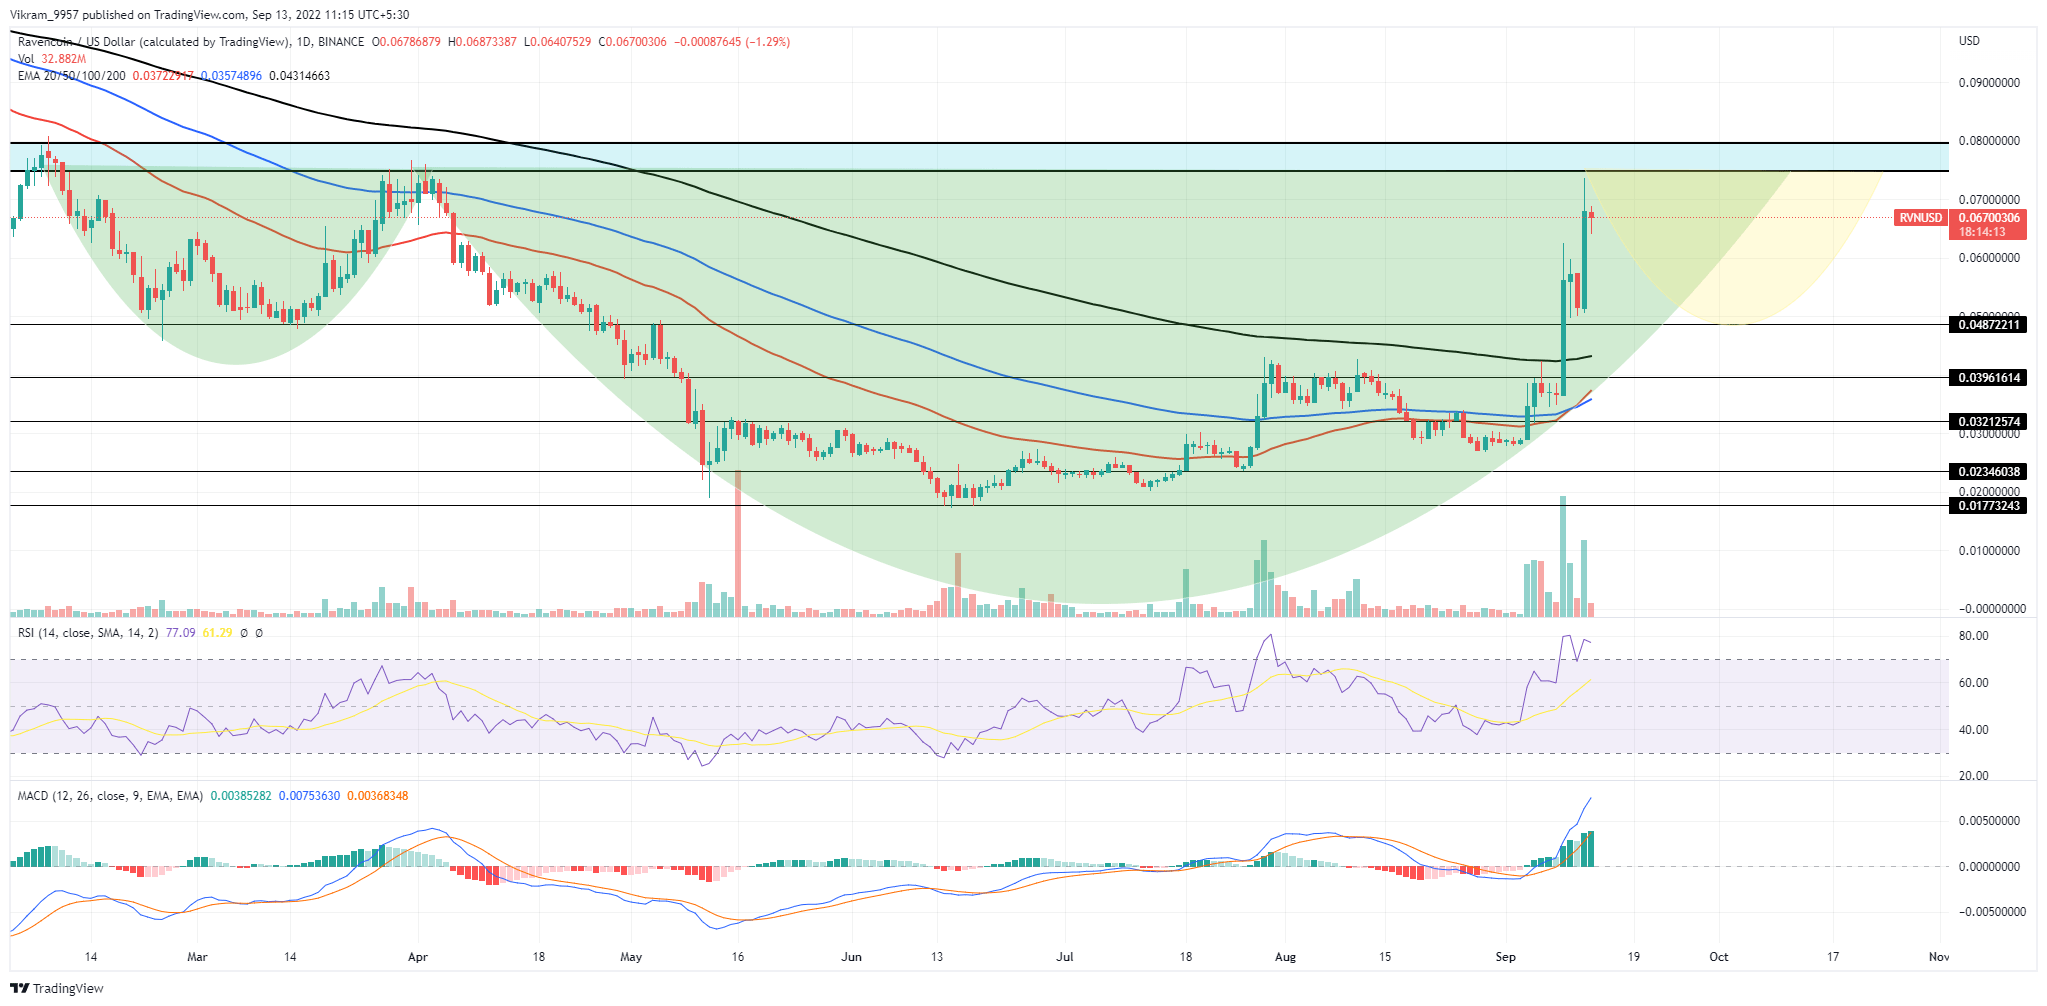
Source — TradingView
RVN Technical Analysis
As mentioned in our previous article, the RVN prices reclaim the psychological mark of $0.050 and continue challenging the overhead resistance of the $0.075 supply zone. However, the increased selling pressure at the supply zone results in a higher price rejection in the bullish candle and influences bearishness on the daily candle. The daily candle shows a reduction of 9.15% in market value with 17 hours left on the clock. Hence after the phenomenal uptrend of 140% within a week, the increased selling pressure teaser returns of the $0.050 breakout. However, the bull run results in a bullish crossover of the 50 and 100 EMA, which increases the possibility of a golden crossover. Nonetheless, the increasing selling pressure warns of a retracement rally to retest $0.050. On a bullish note, if the reverting prices restart, the bullish trend from $0.050 will inchoate an inverted head and shoulder pattern with a neckline at $0.075. The breakout of this pattern will result in a rally surpassing $0.10 and reaching the $0.15 mark.
Technical Indicators
The daily-RSI slope shows the bullish reversal losing momentum as it signals bearish divergence in the overbought zone. However, the MACD indicator is yet to show any weakness, but the slight flaw in the bullish histogram forecasts a difficult time shortly. Thus, the indicators maintain a buy signal for the RVN token. Resistance Levels — $0.075 and $0.10 Support Levels — $0.050 and $0.045


 Bitcoin
  Ethereum
  Tether
  USDC
USDC  Dogecoin
  Cardano
  Bitcoin Cash
  Polygon
  Litecoin
  LEO Token
  Hedera
  Stellar
  Cosmos Hub
  OKB
OKB  Maker
Maker  Algorand
  NEO
NEO  Gate
Gate  KuCoin
  Synthetix Network
  IOTA
IOTA  Tether Gold
  TrueUSD
  Enjin Coin
  Holo
Holo  Ravencoin
  0x Protocol
  Siacoin
  Basic Attention
  Decred
  Zcash
Zcash  Ontology
  Lisk
Lisk  Waves
Waves  DigiByte
  Numeraire
  Status
  Nano
Nano  Pax Dollar
  Steem
Steem  OMG Network
  BUSD
BUSD  Ren
Ren  Bytom
Bytom  Bitcoin Diamond
  HUSD
HUSD  Energi
  Augur
Augur