Shiba Inu (SHIB) Price Reaches Yearly High, but Indicators Show Traders Fear Pullback

The Shiba Inu (SHIB) price is nearing the top of its increase, after which a correction is expected.
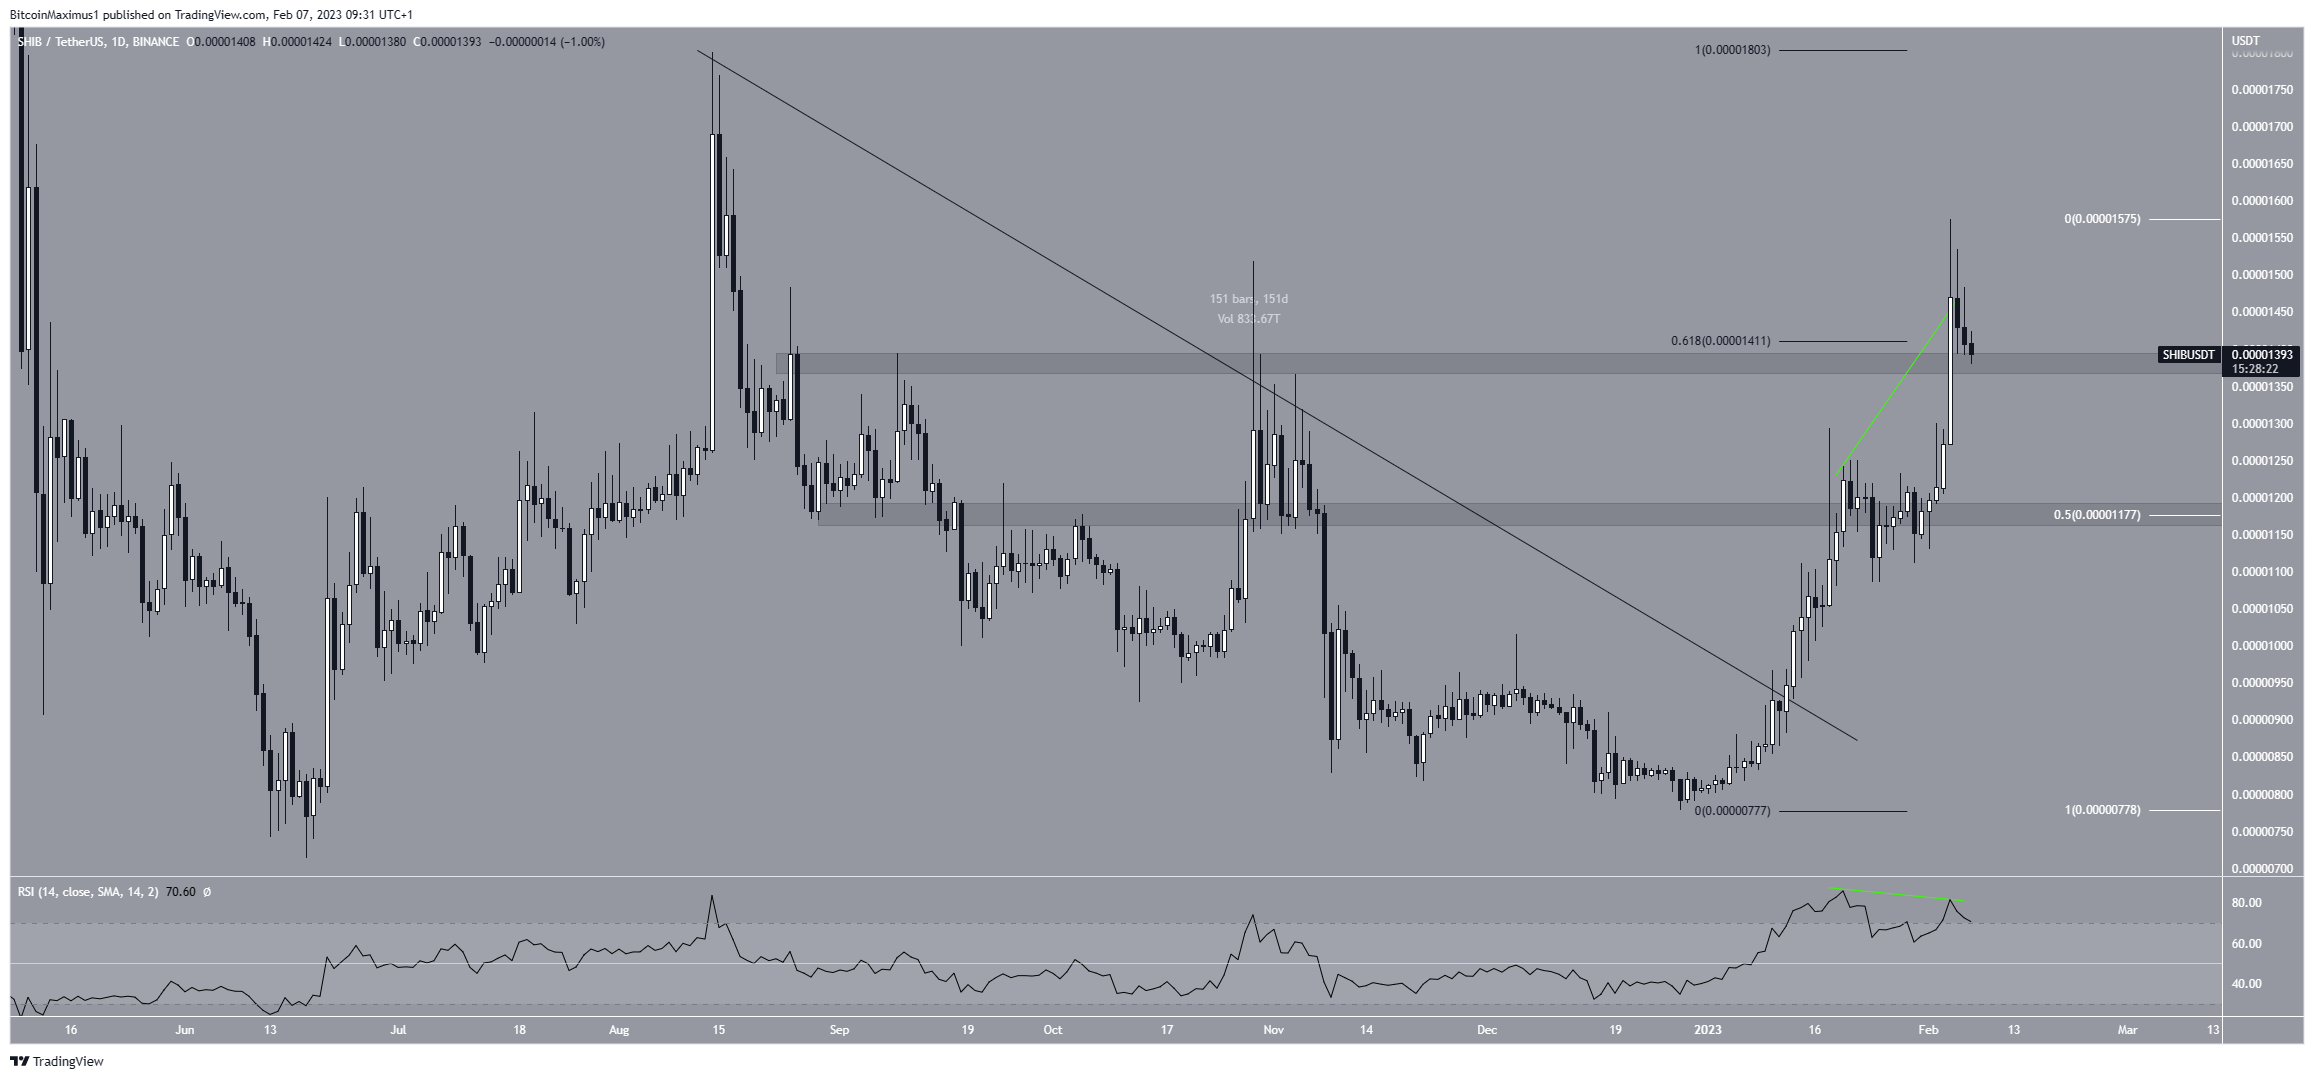
The SHIB price broke out from a 151-day descending resistance line on Jan. 13. The price has increased considerably since, reaching a high of $0.0000157 on Feb. 4. The upward movement also caused the price to reclaim an important resistance area at an average price of $0.0000139. The resistance is created by a horizontal resistance area and the 0.618 Fib retracement resistance level.
After the breakout, the daily RSI generated bearish divergence inside overbought territory. Moreover, the Shiba Inu token price created a long upper wick. As a result, it is possible that a decrease will follow.
Whether the SHIB price falls below the $0.0000139 resistance area could determine the future price’ direction. Staying above the area could lead to a retest of the Aug. 2022 high at $0.0000180. On the other hand, a breakdown from the $0.0000139 area would lead to a drop of $0.0000118.

SHIB/USDT Daily Chart. Source: TradingView
Shiba Inu Price Nears Top of Its Movement
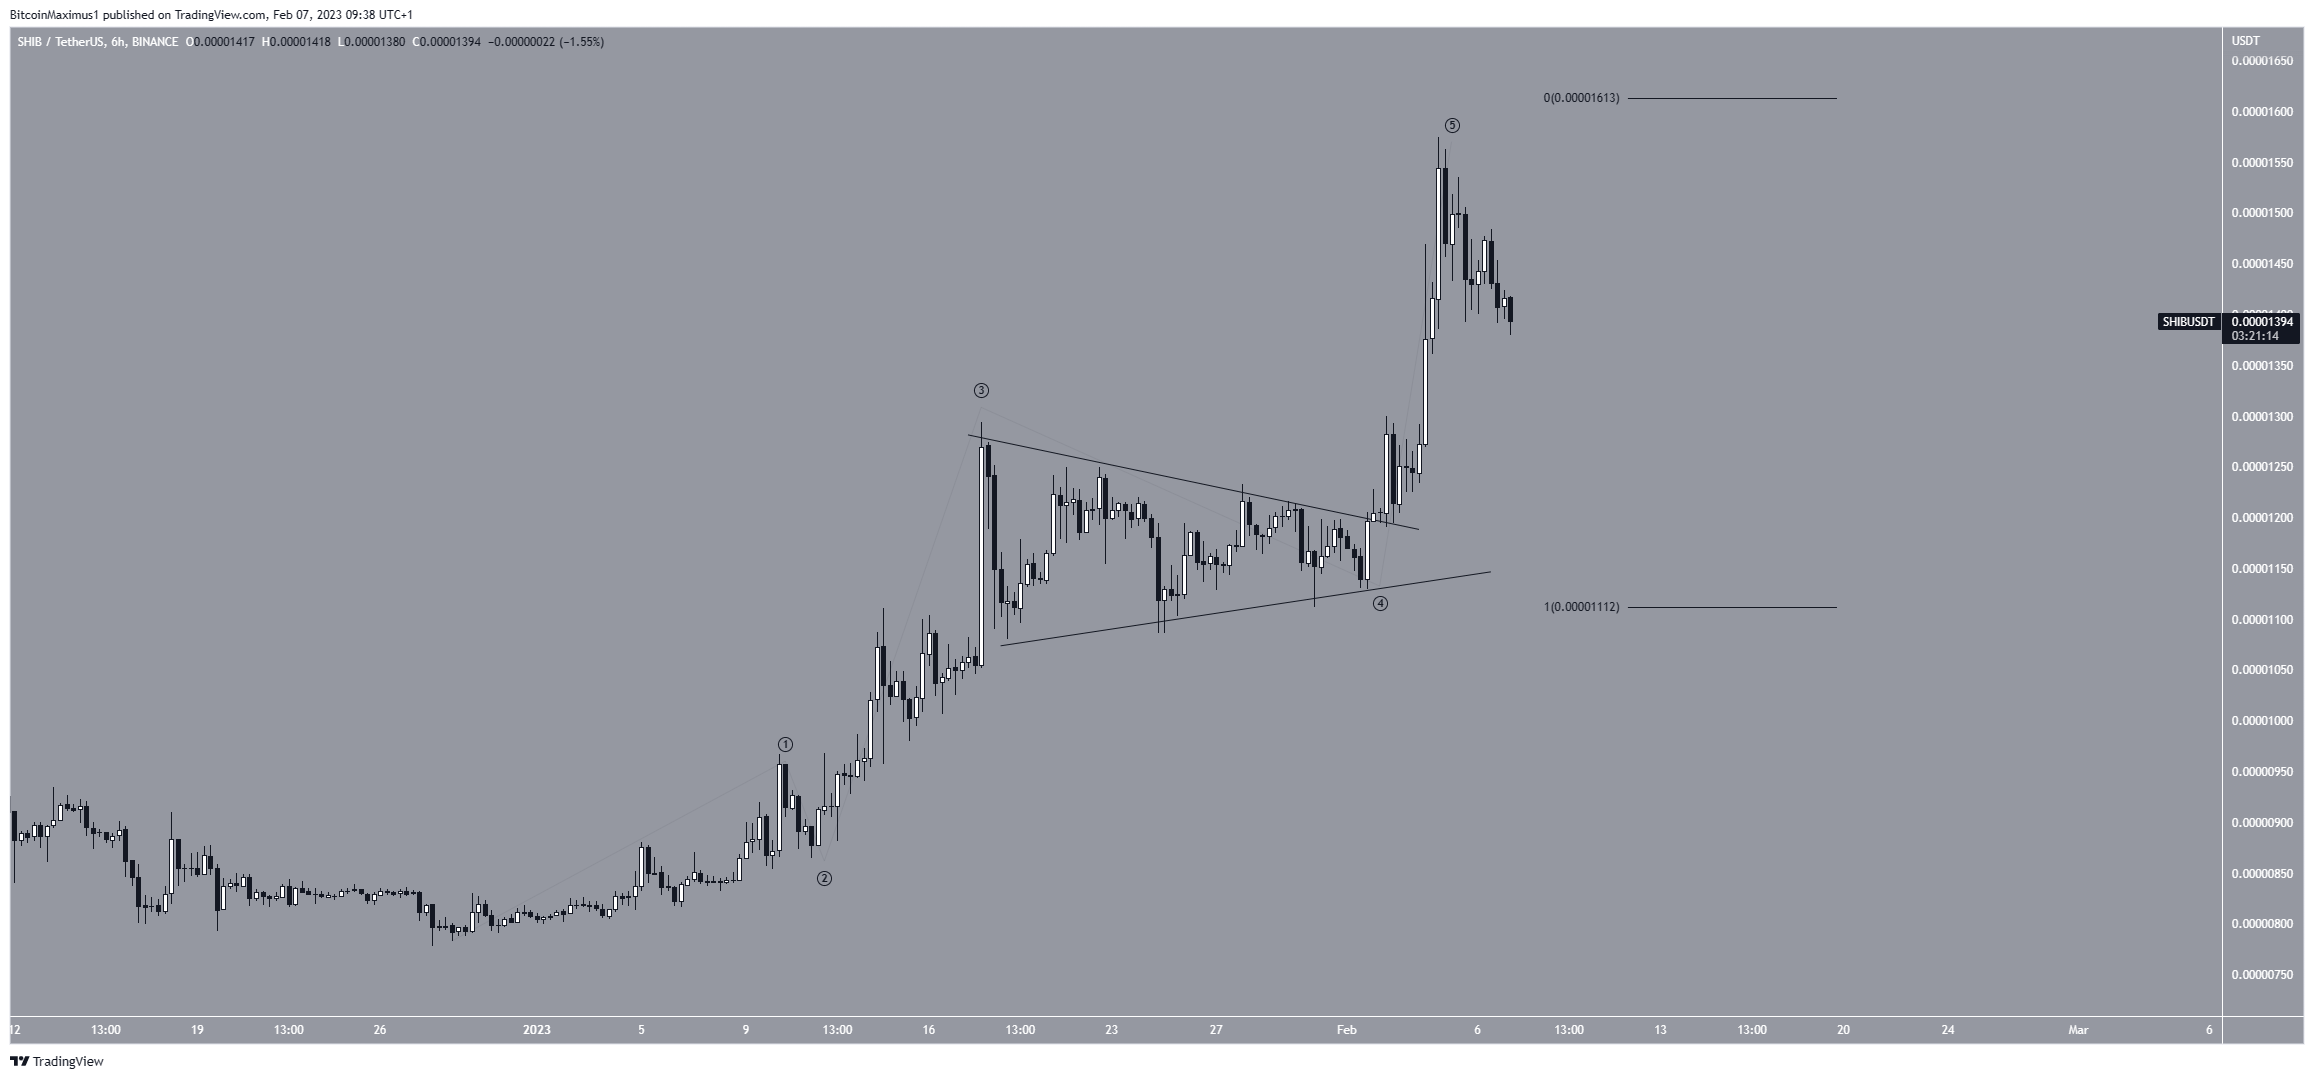
The short-term six-hour technical analysis supports the bearish divergence, indicating that a drop is likely. This is because the SHIB price has completed a five-wave upward movement (black). The presence of the symmetrical triangle in wave four gives credence to this count.
Moreover, the extended wave five had the exact length of waves one and three combined. Therefore, a top may have been reached. The movement in the next 24 hours could help determine if this is correct.
A fall to the previously outlined $0.0000118 support area would also be a retest of the wave four region, which is common in such upward movements.
On the other hand, an increase above the previous high of $0.0000157 would invalidate this bearish forecast. In that case, the SHIB price could increase toward $0.0000180.

SHIB/USDT Six-Hour Chart. Source: TradingView
To conclude, the Shiba Inu (SHIB) price is expected to correct toward $0.0000118. If, however, it manages to increase above $0.0000157, the current wave would extend, leading to highs near $0.0000180.


 Bitcoin
  Ethereum
  Tether
  USDC
USDC  TRON
TRON  Dogecoin
  Cardano
  Bitcoin Cash
  Chainlink
  LEO Token
  Monero
  Stellar
  Zcash
Zcash  Litecoin
  Hedera
  Dai
Dai  Cronos
  OKB
OKB  Tether Gold
  Ethereum Classic
  KuCoin
  Gate
Gate  Algorand
  Cosmos Hub
  VeChain
  Stacks
  Tezos
Tezos  Dash
Dash  TrueUSD
  IOTA
IOTA  Basic Attention
  Theta Network
  Decred
  NEO
NEO  Synthetix
  Qtum
Qtum  Ravencoin
  0x Protocol
  DigiByte
  Zilliqa
  Siacoin
  Nano
Nano  Numeraire
  Waves
Waves  Status
  Ontology
  Enjin Coin
  Hive
Hive  BUSD
BUSD  Lisk
Lisk  Pax Dollar
  Steem
Steem  Huobi
Huobi  NEM
NEM  OMG Network
  Bitcoin Gold
  Bitcoin Diamond
  Augur
Augur