


SOL Sheds 93.49% of Its All Time High Price, What Does 2023 Hold ?
Solana (SOL) dropped 93.49% from its all-time high of $260.06 by 2023. After the FTX crisis, SOL lost roughly 60% of its value overnight. Some hopefully waited for SOL to gain New Year’s buyer momentum and help them recoup some of their losses.
Despite this decline, recent Solana ecosystem advancements seem to have buoyed traders. Bonk Inu (BONK), a dog-themed meme currency on the Solana blockchain network, has been performing well in the crypto market. Since its introduction on January 3, 2023, SOL’s market capitalization rose 3.55% to $6,166,343,155 and 24-hour trading volume rose 28.49% to $956,481,023, reflecting on the growing market interest.
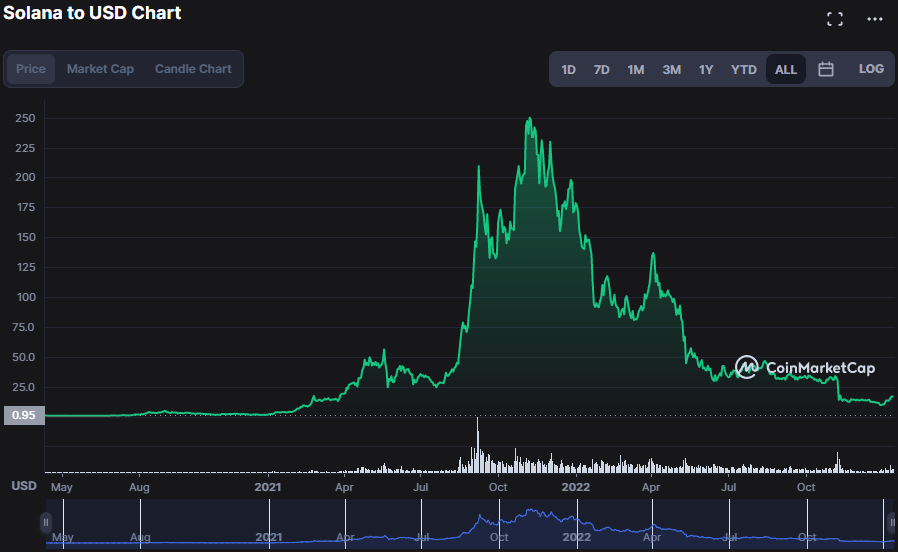
SOL/USD price chart (source: CoinMarketCap)
If the bullish surge in the SOL market continues, the $17.36 resistance level (highest in the previous 30 days) will be breached. This enthusiasm may accelerate the price to a new level, causing a domino effect in the market and leading to an exponential rise in the price of SOL.
If the price breaks through the present resistance level of $17.36 and continues to increase with the same velocity as in previous days, the next resistance levels may be located around $20.63, $25.00, and $27.75, respectively. However, if bullish force fades and the $17.36 resistance level is not achieved, bears may recover momentum and the price may go back to lower levels.
However, the MACD blue line’s dip below the signal line at 0.45 casts doubt on the bullish eruption. Adding fuel to the fire of this pessimistic foreboding is the downward trend of the histogram.

SOL/USD 4-hour price chart (source: TradingView)
The Bull Bear Power (BBP) heading south with a value of 0.36 warns traders that a probable reversal is coming. This movement shows that the purchasing pressure that is pushing the price higher is waning, and that a trend reversal is probable.
Investors in the SOL market should be cautious since the Chaikin Money Flow indicator, at -0.05, shows that the market is projected to fall in the near future. However, the fact that it is trending higher suggests that there is optimism for the market, as investors continue to pump money into it.
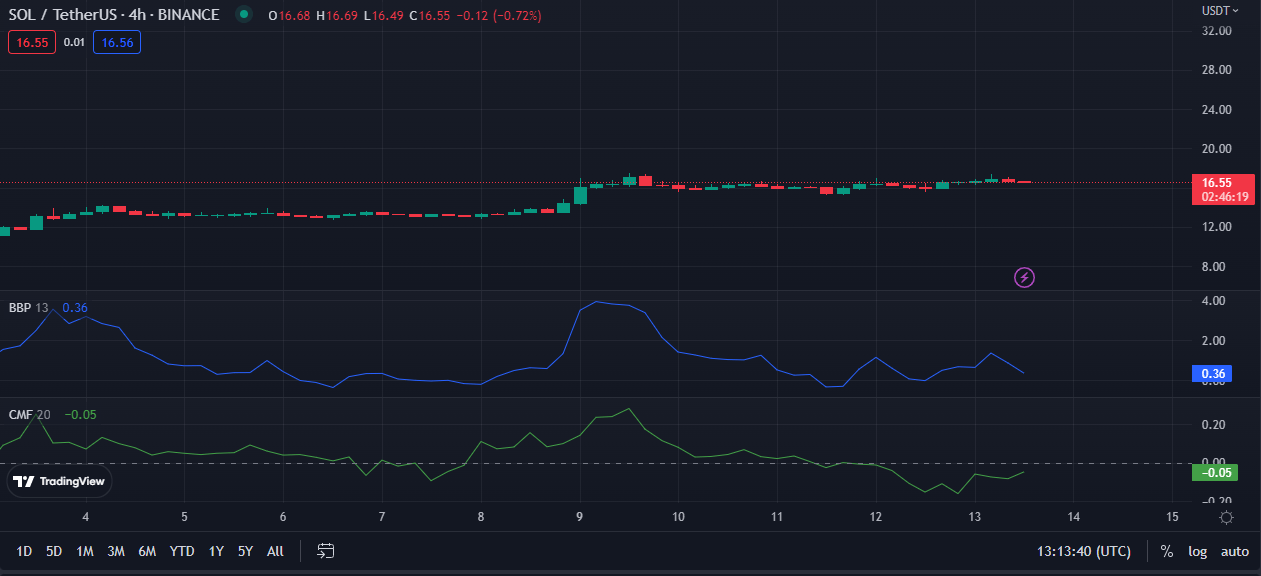
SOL/USD 4-hour price chart (source: TradingView)
Despite the market’s current upward direction, the Solana (SOL) price chart shows that bull momentum is waning.
Disclaimer: The views and opinions, as well as all the information shared in this price analysis, are published in good faith. Readers must do their own research and due diligence. Any action taken by the reader is strictly at their own risk, Coin Edition and its affiliates will not be held liable for any direct or indirect damage or loss.


 Bitcoin
  Ethereum
  Tether
  USDC
USDC  Dogecoin
  Cardano
  Bitcoin Cash
  Polygon
  Litecoin
  LEO Token
  Hedera
  Cosmos Hub
  Stellar
  OKB
OKB  Maker
Maker  Algorand
  NEO
NEO  Gate
Gate  KuCoin
  Synthetix Network
  IOTA
IOTA  Tether Gold
  TrueUSD
  Enjin Coin
  Holo
Holo  Ravencoin
  Siacoin
  0x Protocol
  Basic Attention
  Zcash
Zcash  Decred
  Ontology
  Lisk
Lisk  Waves
Waves  DigiByte
  Nano
Nano  Status
  Numeraire
  Pax Dollar
  Steem
Steem  OMG Network
  BUSD
BUSD  Ren
Ren  Bitcoin Diamond
  Bytom
Bytom  HUSD
HUSD  Energi
  Augur
Augur