


SOLANA coin price analysis: SOL coin price signals strong move

- 1 SOL coin price has shown great strength despite the fall in the overall cryptocurrency market as it trades at the demand zone.
- 2 SOl coin price is forming a symmetrical triangle pattern on a daily time frame.
- 3 The pair of SOL/BTC is trading at the price level of 0.000962 with a decrease of -1.58% in the past 24 hours.
SOLANA coin price as per the price action is still in a bullish trajectory, the coin price is forming higher high and higher low price formation on daily time frame. At present the SOL coin price is trading at the price level of $20.70. As it forms a continuation pattern on a daily time frame to remain to see on which side it will break.
SOLANA coin price forms a positive price structure
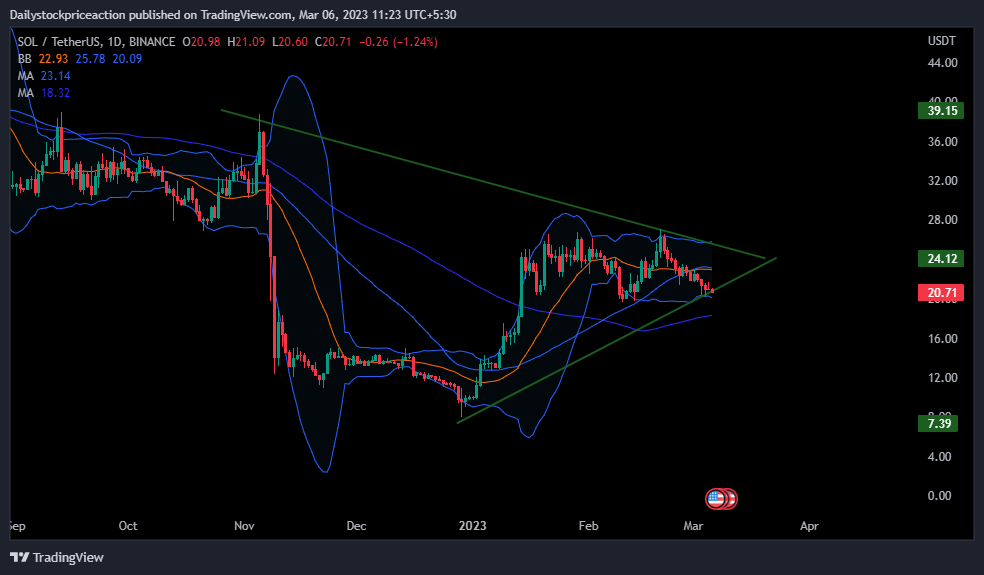
Source: SOL/USDT by tradingview
SOL coin price as per the price action is on a strong uptrend. Recently the coin price faced a strong rejection from the long running green trendline acting as a strong supply zone which has led to a small fall in the coin price. As of now the coin price is trading above the 50 and 100 MAs. Following which ,if the coin price starts moving up again these MAs can be seen acting as a strong demand zone.
At present, the coin price is trading at the lower band of the bollinger band indicator. This comes after the coin price saw a strong bearish pressure from the upper band of the bollinger band indicator. Volumes have increased as the coin price fell indicating a strong volatility to prevail in the market in the upcoming trading days. Therefore the investors should remain cautious and wait for a proper breakout and then act accordingly.
SOLANA coin price is forming a symmetrical triangle pattern on daily time scale

Source: SOL/USDT by tradingview
RSI curve has been seen following the price movement of the SOL coin price as it was seen falling. As the coin price fell to the short term demand zone the RSI curve also fell below. At present, the RSI curve is transacting at the level of 41.76. If the coin price bounces off the demand zone and breaks the supply zone then the RSi curve can be seen crossing the halfway mark of 50 supporting the trend.
ADX curve has been on a downward trend as the coin price falls. As of now the ADX curve has fallen below the mark of 20. Although the ADX curve has turned sideways it remains to see if the coin price shows a bullish strength of the demand zone or falls below it. As of now, the ADX curve is transacting at the level of 15.59.
Conclusion: SOL coin price as per the price action is showing a great bullish strength. The Technical parameters are showing otherwise as they fall, following the trend of the price movement. It remains to see if the coin price will break the supply zone or fails to hold the demand zone and falls below it.
Support: $19.50 and $18.70
Resistance: $25.60 and $24.60


 Bitcoin
  Ethereum
  Tether
  USDC
USDC  Dogecoin
  Cardano
  Bitcoin Cash
  Polygon
  Litecoin
  LEO Token
  Hedera
  Cosmos Hub
  Stellar
  OKB
OKB  Maker
Maker  Algorand
  NEO
NEO  Gate
Gate  KuCoin
  Synthetix Network
  IOTA
IOTA  Tether Gold
  TrueUSD
  Enjin Coin
  Holo
Holo  Siacoin
  0x Protocol
  Ravencoin
  Basic Attention
  Zcash
Zcash  Decred
  Ontology
  Lisk
Lisk  Waves
Waves  DigiByte
  Status
  Numeraire
  Pax Dollar
  Nano
Nano  Steem
Steem  OMG Network
  BUSD
BUSD  Ren
Ren  Bitcoin Diamond
  Bytom
Bytom  HUSD
HUSD  Energi
  Augur
Augur