


Solana price analysis: Bears react, dropping SOL to the $20.66 mark

According to the Solana price analysis, the price value has slightly decreased as of late. As the coin has been consolidating, the bulls have been consistently gaining for the past two days. Because of this, the price of the coin has been fluctuating near the $20 range. The coin’s price has dropped today to $20.66, still in the $20 range, but since the bearish momentum is not very strong, a further decline in value is not anticipated. However, the bears have seized their opportunity to go in front.
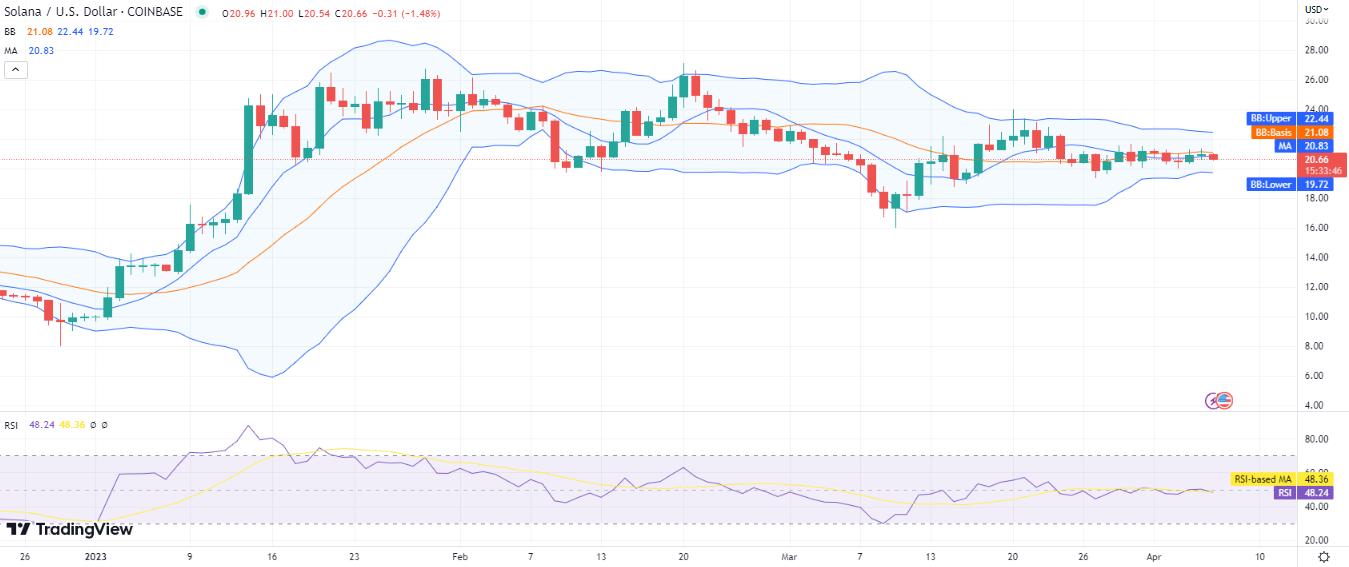
SOL/USD 1-day price chart: Bears re-enter the market, bringing a 2.58 percent loss
After the bears effectively took control of the price action today, the 1-day Solana price analysis predicts a decline in the price. The price has fallen to a value of $20.66, but analysts predict that it will stay range-bound at least for today. The value of the currency has decreased by nearly 2.58 percent over the past 24 hours, and it has decreased by 0.90 percent over the previous 7 days.
SOL/USD 1-day price chart. Source: TradingView
In the 1-day price chart, the moving average (MA) is visible at $20.83, just a hair above the current price value. The average line of the Bollinger bands is currently moving at the $21.08 level. The lower band of the Bollinger bands, which represents support for the falling SOL price, is present at the $19.72 level, while the upper band, which represents resistance, is present at the $22.44 level. This indicates minimal volatility for SOL. The relative strength index (RSI) is also trending slightly lower and has now dipped to index 48 in the lower neutral zone, which suggests that sellers are currently dominating the market.
Solana price analysis: Recent developments and further technical indications
The most recent price data shows that the 4-hour Solana price analysis is also moving in the bears’ favor. After eight hours of activity, the bears are now exhibiting signs of exhaustion, as a small green candlestick has appeared on the hourly chart, signaling the emergence of support for SOL.

SOL/USD 4-hours price chart. Source: TradingView
The bears have since taken back control as the price has fallen to $20.66 from the lead position held by the bulls. The fact that volatility is decreasing is a reassuring indication for the future. Additionally, the moving average for the 4-hour price indicator is currently $20.93.
Additionally, the Bollinger bands are converging, which has led to the upper band reaching a value of $21.33 and the lower band reaching a value of $20.21. The RSI score has leveled off at index 45 as the bullish support has just entered, and the RSI curve has also gone horizontal.
Solana price analysis conclusion
The price of Solana has dropped to $20.66, confirming the resumption of the bearish momentum, according to the 1-day and 4-hour price analysis. The market has seen more sellers than buyers, which is why the bearish tendency has persisted. However, if the recent support holds, then the following trading period may see a revival of trends.


 Bitcoin
  Ethereum
  Tether
  USDC
USDC  Dogecoin
  Cardano
  Bitcoin Cash
  Polygon
  Litecoin
  LEO Token
  Hedera
  Cosmos Hub
  Stellar
  OKB
OKB  Maker
Maker  Algorand
  NEO
NEO  Gate
Gate  KuCoin
  Synthetix Network
  IOTA
IOTA  Tether Gold
  TrueUSD
  Enjin Coin
  0x Protocol
  Siacoin
  Ravencoin
  Holo
Holo  Basic Attention
  Zcash
Zcash  Decred
  Ontology
  Lisk
Lisk  Waves
Waves  DigiByte
  Numeraire
  Nano
Nano  Pax Dollar
  Status
  Steem
Steem  OMG Network
  BUSD
BUSD  Ren
Ren  Bytom
Bytom  Bitcoin Diamond
  HUSD
HUSD  Energi
  Augur
Augur