


Technical Indicators for MATIC Show It Could Break $0.5845

The price of Polygon (MATIC) recovered slightly over the past 24 hours following its 33.13% drop over the past week. At press time, CoinMarketCap indicated that the altcoin was trading at $0.6049 after printing a 3.70% gain in the last day.
MATIC was trading closer to its 24-hour high of $0.6148, while its daily low was at $0.5593 at press time. Furthermore, its daily trading volume dropped more than 30% over the past 24 hours and stood at around $666 million as a result.
The Layer-2 crypto also made its way to CoinMarketCap’s trending list and occupied the number 2 position. This ranked its behind Binance Coin (BNB) and ahead of ChitCAT (CHITCAT).
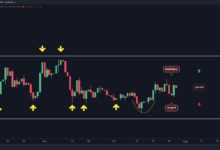
Daily chart for MATIC/USDT (Source: TradingView)
MATIC’s price had plummeted below the key support level at $0.7183 in the past 24 hours to test the next crucial support level at $0.5845 as well. It had dropped below this mark but was able to close yesterday’s trading session back above the key price point.
At press time, the altcoin’s price was trading slightly above the $0.5845 support and remained at risk of dropping below the level in the next 24-48 hours. Technical indicators on MATIC’s daily chart supported the bearish thesis.
The 9-day EMA was positioned below the 20-day EMA. Furthermore, the daily RSI line was in extreme oversold territory, which indicated that there was an overwhelming amount of sell pressure still present on MATIC’s chart.
Should these technical flags be validated in the next 24 hours, the crypto’s price will flip the aforementioned $0.5845 support level into resistance. On the other hand, if MATIC’s price is able to remain above this point for the next 48 hours, then bulls might identify a buy opportunity for the altcoin.
This will then see MATIC’s price rise to $0.7183 and potentially reclaim a position above the recently-breached level. Should this happen, the crypto will then have a relatively clear path to climb to the next major resistance level at $0.8159.
Investors and traders may want to wait for the daily RSI line to cross bullishly above the daily RSI SMA line before entering into a long position for the crypto. This will serve as a confirmation of the bullish thesis.
Disclaimer: The views and opinions, as well as all the information shared in this price analysis, are published in good faith. Readers must do their own research and due diligence. Any action taken by the reader is strictly at their own risk. Coin Edition and its affiliates will not be held liable for any direct or indirect damage or loss.


 Bitcoin
  Ethereum
  Tether
  USDC
USDC  Dogecoin
  Cardano
  Bitcoin Cash
  Polygon
  Litecoin
  LEO Token
  Hedera
  Stellar
  Cosmos Hub
  OKB
OKB  Maker
Maker  Algorand
  NEO
NEO  Gate
Gate  Synthetix Network
  KuCoin
  IOTA
IOTA  Tether Gold
  TrueUSD
  Enjin Coin
  Holo
Holo  Ravencoin
  0x Protocol
  Siacoin
  Basic Attention
  Ontology
  Zcash
Zcash  Decred
  Lisk
Lisk  Waves
Waves  DigiByte
  Status
  Numeraire
  Nano
Nano  Pax Dollar
  Steem
Steem  OMG Network
  BUSD
BUSD  Ren
Ren  Bytom
Bytom  Bitcoin Diamond
  HUSD
HUSD  Energi
  Augur
Augur