


The Best Months For Crypto: How do Markets Perform In February?

Seasonal effects are common in financial data sets. The prices of commodities change because of the shifts in temperature between the summer and winter months. The prices of stocks are affected by the annual earnings season and the Christmas holiday period.
The digital asset class is no different. While it’s true that there is only 10 years of data to draw from, if someone asks ‘what are the best months for crypto’ there are a range of observations that can be made. This article looks at what Bitcoin and the rest of the crypto markets are more likely to do during particular months or quarters of the year.
For example, digital assets still react to impending tax seasons and holidays like Chinese New Year. As we enter the second month of 2023, following a bullish beginning to the year, Brave New Coin explores the historical price performance of Bitcoin and Ethereum in February to see if any emerging patterns can add information to crypto trading and investment strategies.
Bitcoin in February
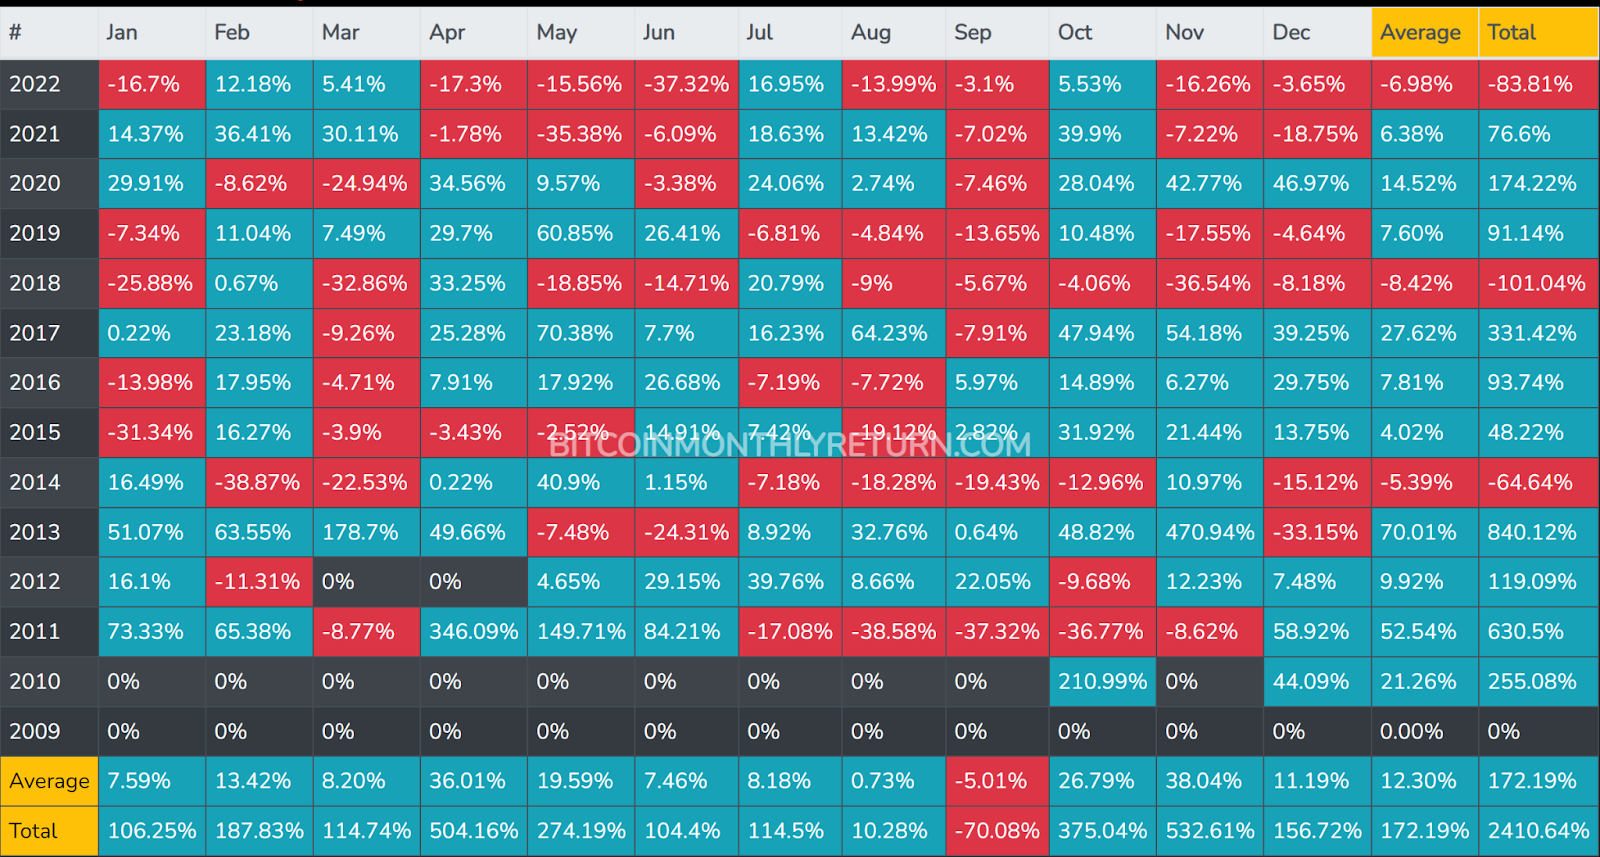
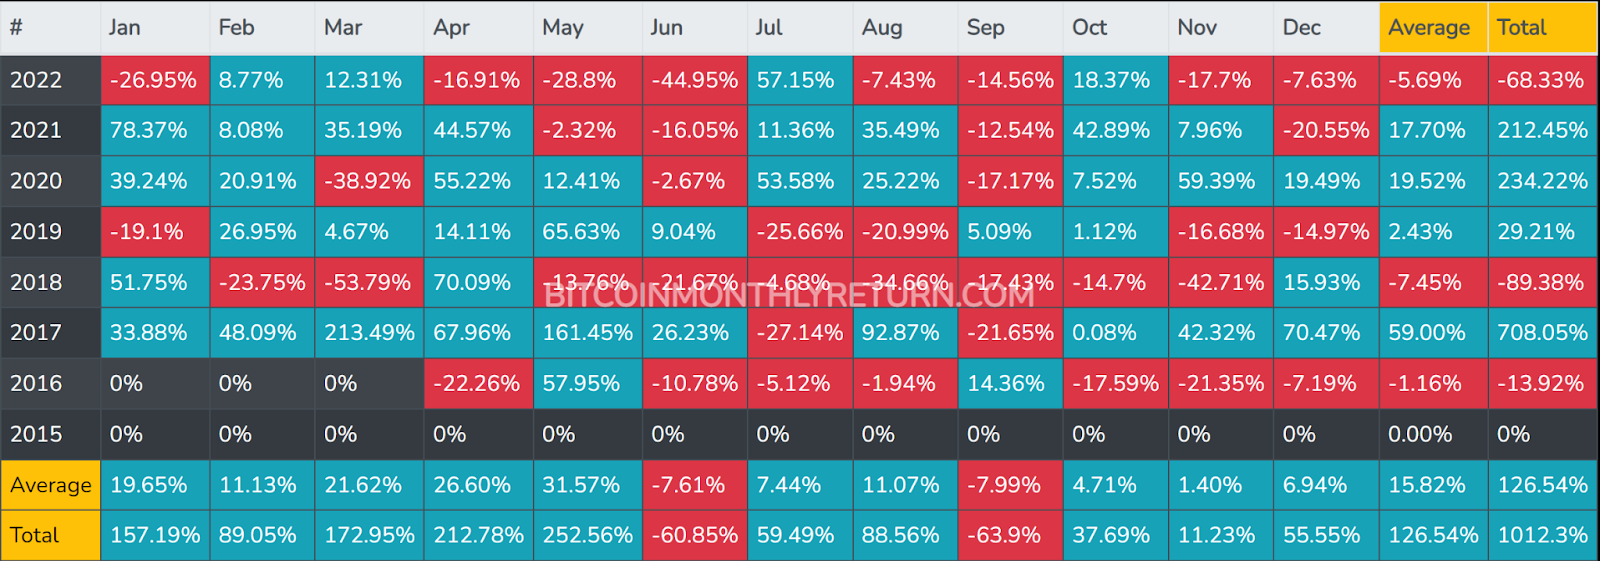
Source: https://www.bitcoinmonthlyreturn.com/ (Updated)
February has historically been a strong month for Bitcoin. Over the last 12 years, on average, the price of BTC has risen by ~13.4% during the month. In nine of the last 12 years, Bitcoin enjoyed positive gains in February. Only April matches the same level of consistent year-to-year results (also nine out of the last 12).
Overall, the best months for crypto historically, and for Bitcoin in particular, have been November and April. But after a difficult end to the year 2022 and a strong January 2023, we may need to reconsider and suggest that the best months may be between January-April.
The extended summer months, between May and October, have generally been a period of seasonal weakness. In trading, there is a saying “sell in May and go away”, it is based on stocks’ historical underperformance during this 6-month period.
Bitcoin loves Valentine’s day
Another odd quirk is that Bitcoin has consistently performed well around Valentine’s day.
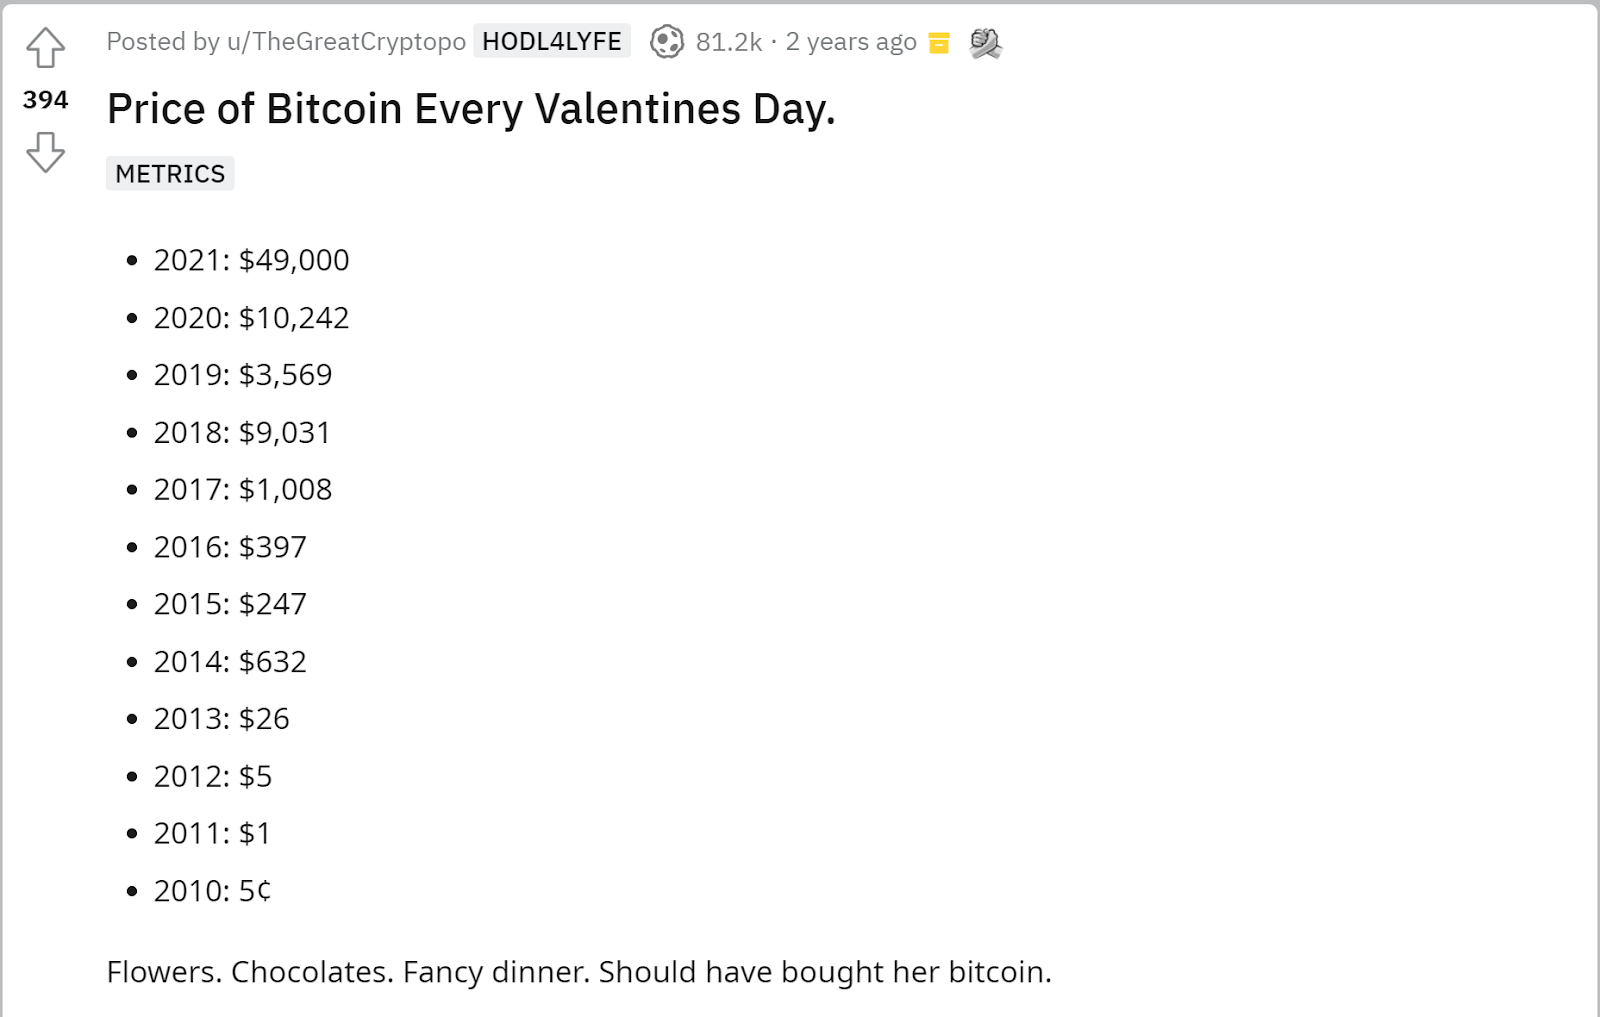
Source: Reddit.com
This popular post from r/cryptocurrency from two years ago highlights the excellent price growth of Bitcoin across the 11 years between 2010 and 2021. Unfortunately, this trend has been broken. In 2022, the price of BTC on Valentine’s day was ~US$42,248, less than its price was in 2021.
Currently the price of BTC is ~US$22,698, unless the price has an exceptional and unlikely upturn, then the 2023 Valentine’s day price is going to be less than the 2022 Valentine’s day price.
A potential factor for why Bitcoin may perform well in the lead-up to Valentine’s day is the gift narrative. Valentine’s day is a significant cultural, religious, and commercial celebration of love and romance across the globe. Partners traditionally gift each other with chocolates, flowers, perfume, and other romantic gifts. Bitcoin may have emerged as a signal of love for libertarians and the financially minded.
Bitcoin works well as a gift and on Chinese New Year there are strong signs that BTC is bought heavily for gifts for this holiday. Its portability, privacy characteristics, and digital nature mean Bitcoin can be transferred between lovers with reduced paperwork and legal obligations/provisions.
This year, with the crypto markets enjoying momentum and improved sentiment, there appear to be intuitive arguments for why Bitcoiners may buy loved ones BTC for Valentine’s Day 2023.
Bitcoin Monthly Returns
The average monthly return for Bitcoin between the beginning of November and the end of April since 2011 is ~19.1%. The average monthly return in the other six months of the year is ~9.6%. February is notable because even in bearish years for Bitcoin, BTC has risen during the month of February.


2023 has so far been excellent for Bitcoin. The asset is up ~37.4% in the month and has outperformed tech stocks and other large-cap assets like Ethereum (ETH). It should be noted that in the years when Bitcoin dropped in February, the price fall was preceded by a strong January.
The draw-down since Bitcoin reached its last all-time high, currently stands at ~57.8%. The all-time high price of the asset of ~US$69,050 was hit on Nov 10, 2021. The asset currently trades for US$22,787.
While a 57% drawdown may turn participants from legacy financial markets as white as a sheet, large drawdowns of over 50% happen often in crypto markets in general — and regularly for Bitcoin.
The current drawdown currently ranks as only Bitcoin’s 4th steepest decline ever.
Despite Bitcoin having an excellent January 2023, It is not yet clear whether the price of BTC has hit its Macro bottom. The price of the asset may turn around in the coming weeks and months, but there may still be more bearish price action to come before we can determine exactly where the current price drop will stand amongst BTC’s other price collapses.
Bitcoin has so far recovered from its historical large drawdowns and in each of the mentioned price declines, BTC bulls have reclaimed the price it fell from. However, the time for each recovery was at least three times as long as the drawdown. The recovery to reclaim the original price from the two longer drawdowns mentioned, 2013 to 2015 and 2017 to 2018, took almost three years.
Market sentiment in the leadup to February 2023
Bitcoin and the crypto asset class in general have begun the year strongly on the back of cooler supply chain (PMI) and wage (non-farm payrolls) reports. These economic indicators suggest that US inflation may have peaked and that interest rate rises in the country will slow. While more drama surrounding the FTX comes out through January 2023, markets appear uninterested. They have continued to buy, suggesting the FTX incident which caused a severe price blowup towards the end of 2022, has been priced in.
The first CPI print of the year was released on January 19th. The report, which covered consumer prices in December 2022, showed that prices rose by 6.5% in the month. This was the smallest increase in a year and the sixth month in a row when the inflation rate had slowed.
Traders are now waiting for the next FOMC meeting on the 1st of February. Most of the market is expecting a 0.25 interest rate rise. This is below the 0.5% rate hikes that were executed at the last meeting.
The confidence that a 25 basis point rise is coming, likely means that the lower interest rate rise is priced in. The main output from the meeting is likely to be an insight into what the Fed’s plans will be for May, June, and further beyond. Many expect interest rate rises to stop at around 5%. The current rate is 4.25%-4.5%.
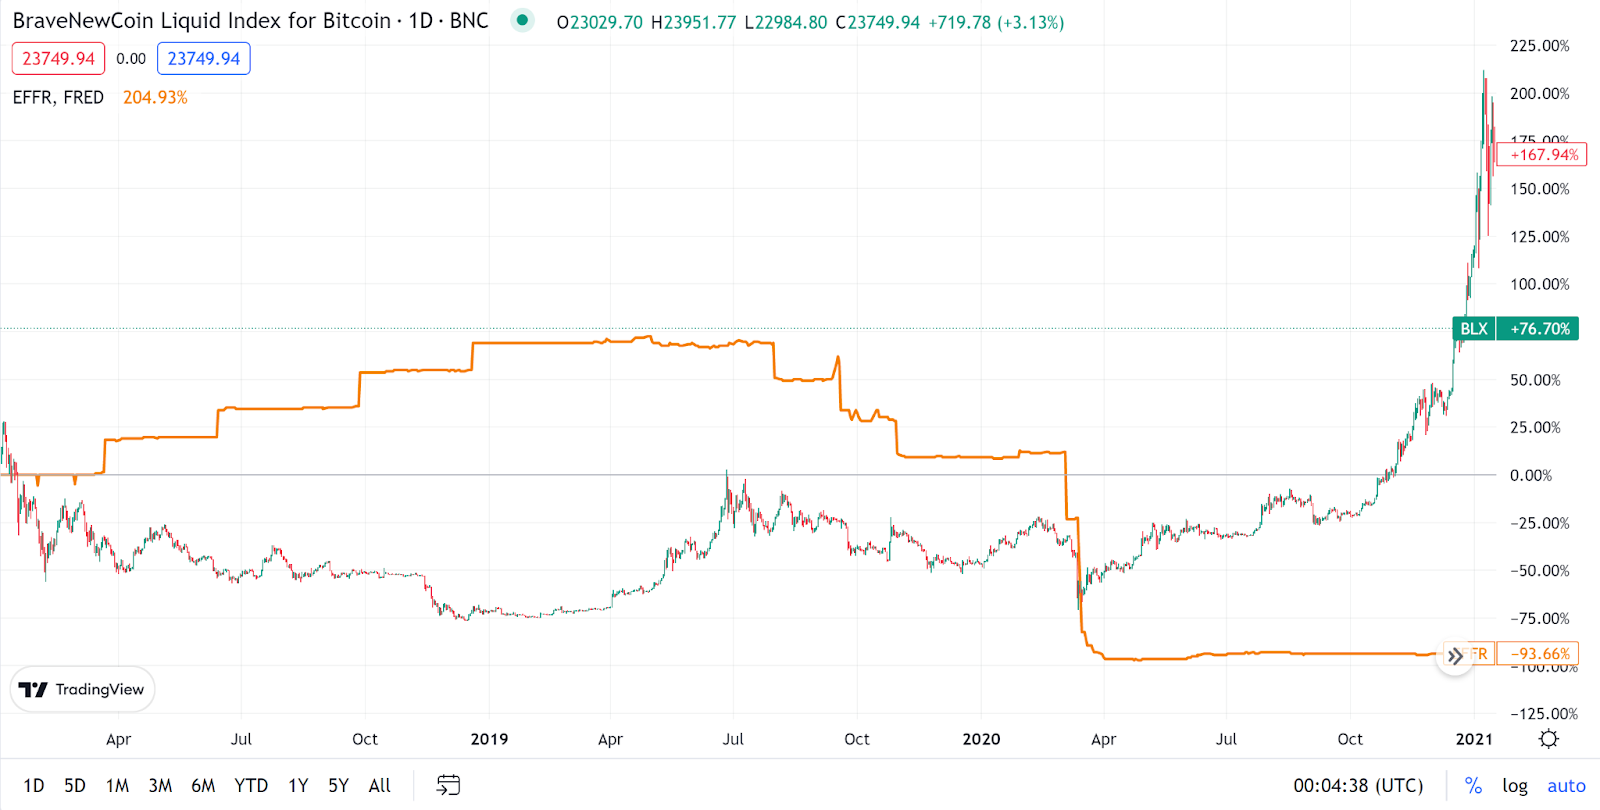
If the Fed’s tightening cycle shows signs of ending, then Bitcoin and crypto could be set to begin a bullish flip as the shackles are pulled off investors. When the Fed finished its last tightening cycle in 2019, BTC and crypto began an extended bullish price reversal. As the chart above indicates, in the months after the Fed started to cut interest rates, the price of BTC traded sideways. Once the Fed began to aggressively drop interest rates, the price of BTC began to skyrocket.
Bulls have been aggressive because of broad signals that interest rate cuts are set to occur around the time when Fed’s target rates hit 5%.
As mentioned, however, there are divergent views across the market.There are many forecasters and economists, however, who view the current bullish momentum as a trap.
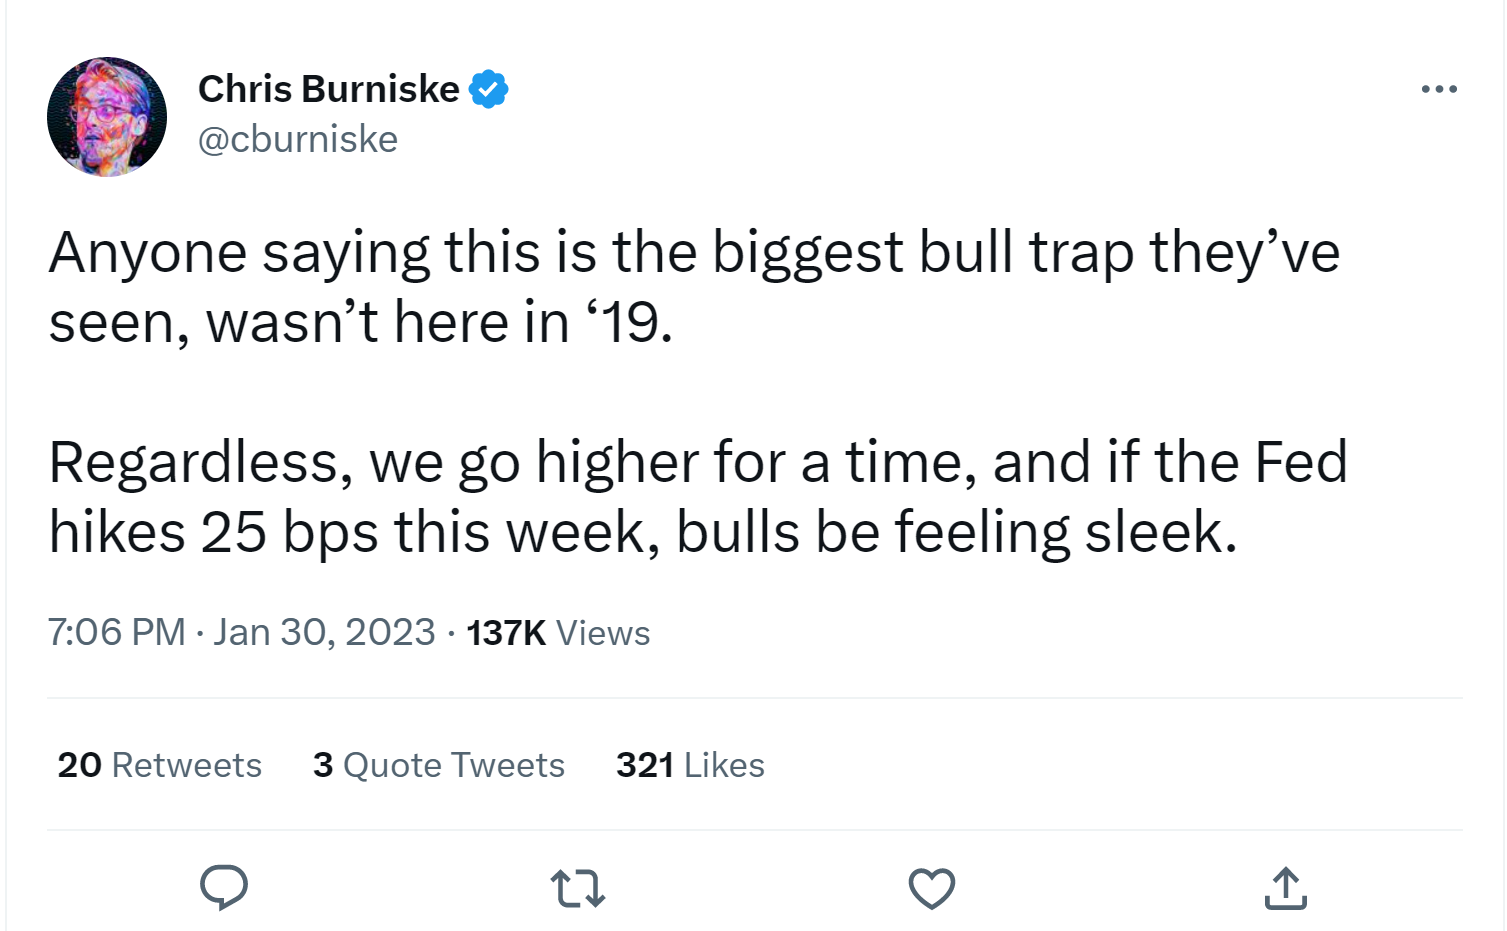
Source: Twitter
In general, the global economic outlook for 2023 appears to be bleak to middling. The World Bank recently slashed its global economic growth figure for 2023 to 1.7% from its previous number of 3%. The World Bank said this would be “the third weakest pace of growth in nearly three decades”, only comparable to periods during the Global Financial Crisis and the height of the pandemic. US growth is predicted to be 1% and in Europe & Central Asia 0.1%.
JP Morgan predicts a mild recession in the US this year, though its forecast is particularly bearish about discretionary spending and capital investments. The investment bank suggested more losses in the stock market and across other asset classes simultaneously including crypto, housing, bonds, and alternative/private investments. It predicts fundamentals will deteriorate and constrictive interest rates will continue to be a cloud over speculative investments.
A factor in the ongoing price run has been a short squeeze. Short squeezes occur when short traders are forced to close their positions (at a loss) due to a sudden price increase. These traders are forced to cover these positions quickly before the price goes even higher. If enough shorters are caught in this position, then the subsequent squeeze can have a tangible effect on price.
Ethereum price performance in February
Source: https://ethereummonthlyreturn.com/ (updated)
Ethereum is even more consistent than Bitcoin is in February. No other month has so consistently offered more positive returns. Only once in the last 6 years, ETH has not risen in value.
Ethereum’s strongest months tend to be between December and May. ETH’s average return across these months is ~19.6%. For the other 6 months of the year, the average return of ETH was 1.5%.
The price of Ethereum (ETH) is up ~31.8% since the beginning of the year. The key factor in this price rise has been an improved global macro situation but another more specific factor is the hype surrounding the upcoming Shanghai hard fork. This will be the biggest Ethereum upgrade since the Merge and Ethereum developers have committed to a March 2023 implementation.
The Shanghai upgrade will include Ethereum Improvement Proposal (EIP) 4895. This will allow for Beacon Chain staked Ether withdrawals. This is Ether that has been staked to the network by validators and delegators and has been inaccessible for months.
There are some concerns that the large unlock will lead to a wave of selling pressure as stakers can finally regain liquidity, but some observers say the unlocked ETH liquidity will be swept up by new demand to stake. There is also a view that ETH staking will increase post-Shanghai given the new flexibility offered to stakers.
Despite being the most staked asset in crypto, the ratio of staked ETH is just 13.99% of the total ETH supply according to stakingrewards.com. This compares poorly to the ratio of staked assets on other major Proof-of-Stake chains like the BNB-chain, Cardano, and Solana, all of which have ratios of staked assets sitting above 70%.
Conclusion
If you’re looking for the best month for crypto, February may not offer the highest returns but it is very consistent. Heading into February 2023, markets appear to have momentum and are heading into February with bullish pressure. 2022 was a difficult year for crypto. It is not yet clear whether the negative macro headwinds dragging down markets have cleared. While we appear to be at the end of a Fed tightening cycle, the possibility of a recession looms large over the global economy.


 Bitcoin
  Ethereum
  Tether
  USDC
USDC  Dogecoin
  Cardano
  Bitcoin Cash
  Polygon
  Litecoin
  LEO Token
  Hedera
  Cosmos Hub
  Stellar
  OKB
OKB  Maker
Maker  Algorand
  Gate
Gate  NEO
NEO  KuCoin
  Synthetix Network
  IOTA
IOTA  Tether Gold
  TrueUSD
  Enjin Coin
  Siacoin
  Holo
Holo  0x Protocol
  Ravencoin
  Zcash
Zcash  Basic Attention
  Lisk
Lisk  Decred
  Ontology
  Waves
Waves  DigiByte
  Numeraire
  Pax Dollar
  Status
  Nano
Nano  Steem
Steem  OMG Network
  BUSD
BUSD  Ren
Ren  Bytom
Bytom  Bitcoin Diamond
  Augur
Augur  Energi
  HUSD
HUSD