


The Graph Price Prediction: Will GRT Escape Consolidation?
- 1 The Graph is currently trading at $0.1412 (press time) with a decrease of 3.27% intraday.
- 2 The 24-hour low for GRT was $0.1408 and the 24-hour high was $0.1478.
- 3 The current Graph price is between the 20-, and 200-Day EMAs.
The Graph Overview:
The Graph is a protocol that enables developers to build and publish open APIs, known as subgraphs, for querying blockchain data using GraphQL. It currently supports Ethereum, IPFS, and POA, with more networks to be added soon. The Graph, which has more than 3,000 subgraphs deployed by thousands of developers, has established itself as a crucial tool for DeFi and Web3 applications. By September 2020, it was being used for more than 7 billion inquiries, expanding at a rate of more than 50% MoM.
With more than 200 Indexer Nodes in the testnet and more than 2,000 Curators in the Curator Program, The Graph has a large international community. The Graph has received almost $25 million from the community, strategic VCs, and well-known figures in the blockchain world to pay for network growth.
Participants in the Graph Network use Graph Token to guarantee the security and integrity of the data being accessed (GRT). To provide indexing and curating services to the network, it is a work token that is locked up by indexers, curators, and delegators. Active members can receive compensation from the network in proportion to the effort they contribute and the value of their GRT investment.
The Graph is on a mission to bring reliable decentralized public infrastructure to the mainstream market, and its team includes professionals from leading tech companies such as Ethereum Foundation, OpenZeppelin, Decentraland, Orchid, MuleSoft, Redhat, and Barclays. The founders have worked together for 5-8 years, and Yaniv Tal, Brandon Ramirez, and Jannis Pohlmann lead the project.
The Graph Technical Analysis :
The GRT/BTC pair saw a decrease of 3.07% intraday, with a trading value of 0.000005068 BTC. However, the GRT token price suffered a significant decline of 65.77% in the previous year, indicating a substantial impact from sellers. With the market experiencing strong selling pressure, the GRT token remained below its secondary support level of $0.113 as of the end of 2022.
GRT’s volume dropped by 36.82% intraday. The volume’s continued drop shows that the short-selling pressure is increasing. The market cap-to-volume ratio is 0.0283. For investors, the fact that purchasing is growing may be comforting. Investors could choose to shift to either side. Additionally, this will present a chance for new buyers to join the market.
Price prediction for the Graph suggests that the future of GRT largely depends on the actions of buyers in the market. If the buyers are able to push the value of GRT past its primary resistance level of $0.162, the token may experience a significant upward rally over the daily time frame chart. This means that the price of GRT could potentially rise in the near future if there is enough demand from buyers to drive the price upwards.
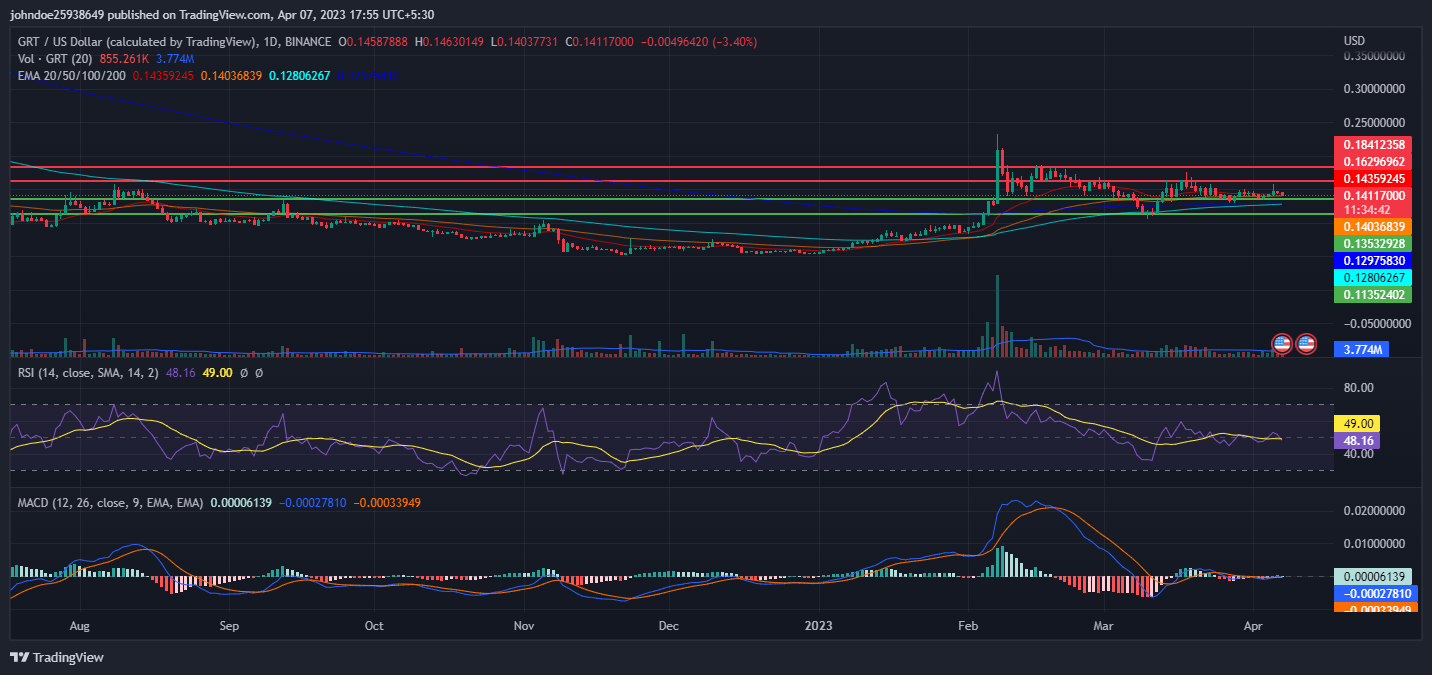
Source: GRT/USD by Tradingview
RSI is decreasing in the overbought zone and is showing a negative crossover which indicates that the sellers are coming in the majority and pushing GRT downwards. This suggests the strength of the current bearish trend. The current value of RSI is 48.16 which is below the average RSI value of 49.00.
The MACD and the signal line are stranded near zero and are not showing a definitive crossover over the daily chart which can support the RSI claims. Investors need to watch every move over the charts during the day’s trading session.
Conclusion
The Graph protocol has established itself as a crucial tool for DeFi and Web3 applications. By September 2020, it had been utilized for more than 7 billion queries, growing at a rate of more than 50% MoM, with thousands of developers deploying more than 3,000 subgraphs. With more than 200 Indexer Nodes on the testnet and more than 2,000 Curators in the Curator Program, the protocol has a sizable international community.
The Graph has secured nearly $25 million to fund network expansion in its mission to bring dependable decentralized public infrastructure to the mass market. Future price movements of GRT could be significantly higher if it surpasses its main resistance level, which is highly dependent on market buyers’ activities. However, the current technical analysis suggests a bearish trend, with decreasing RSI in the overbought zone and a negative MACD signal. Investors must watch every move over the charts during the day’s trading session.
Technical Levels
Support Levels: $0.135 and $0.113
Resistance Levels: $0.162 and $0.184
Disclaimer
The views and opinions stated by the author, or any people named in this article, are for informational ideas only. They do not establish financial, investment, or other advice. Investing in or trading crypto assets comes with a risk of financial loss.


 Bitcoin
  Ethereum
  Tether
  USDC
USDC  Dogecoin
  Cardano
  Bitcoin Cash
  Polygon
  Litecoin
  LEO Token
  Hedera
  Stellar
  Cosmos Hub
  OKB
OKB  Maker
Maker  Algorand
  NEO
NEO  Gate
Gate  Synthetix Network
  KuCoin
  IOTA
IOTA  Tether Gold
  TrueUSD
  Holo
Holo  Enjin Coin
  Ravencoin
  0x Protocol
  Siacoin
  Basic Attention
  Ontology
  Zcash
Zcash  Decred
  Lisk
Lisk  Waves
Waves  DigiByte
  Nano
Nano  Status
  Numeraire
  Pax Dollar
  Steem
Steem  OMG Network
  BUSD
BUSD  Ren
Ren  Bitcoin Diamond
  Bytom
Bytom  HUSD
HUSD  Energi
  Augur
Augur