


THETA Price Analysis: Will THETA Price Return to the Bears?

- 1 The THETA price is trading at $1.014; seeing a change of 60% in 24-hour trading volume.
- 2 The THETA token has been seeing a slight increase in price of 4.14% in the last 24 hours.
THETA price is trading within a descending channel on the daily timeframe. For the last few months, the price of THETA has been trading under the 200 EMA. Investors’ sentiments are currently influenced by bears. The descending flag pattern is often considered a forebear of a bull trend. Though this bullish indicator may not be sufficient for a change of trend. Observing the previous price pattern it has been taking constant rejection from the 100 EMA where its major resistance is 200 EMA.
The price of THETA is currently trading in the supply zone in a shorter time frame. The price is giving precise movements within a consolidation channel. Though the Oscillators have recently broken the consolidation which suggests that the price may soon be their lead.
THETA Price is Trending Within a Descending Consolidation Channel
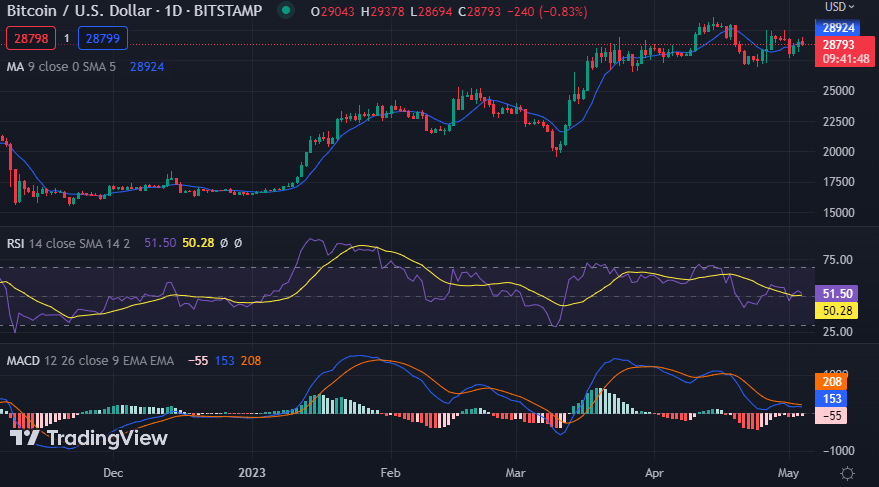
Source: THETA/USDT by TradingView
The price started its bull trend in early January where it gained more than 54% of its total value. The THETA made its last higher high near $1.300.The price despite making multiple attempts to cross above the 200 EMA was not able to succeed.
After breaking down below the trendline in early March, Theta Network’s price lost 21% of its overall value, making a lower low.
However, the bullish sentiments were proven to be temporary when after making a hammer pattern near its base support line of around $0.850, Theta Network gained the support of the buyers and made a bullish rally of 30%.
Technical Analysis of the THETA Price
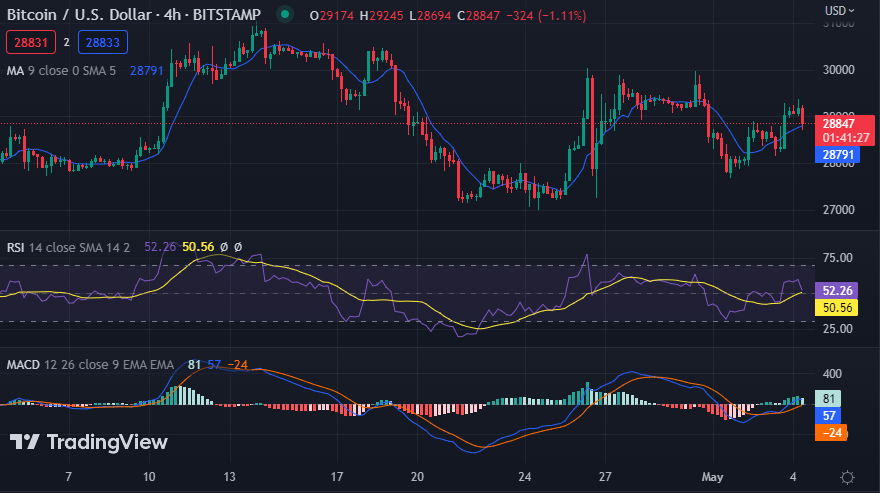
Source: THETA/USDT by TradingView
In the 4 Hr time frame, The RSI is at the present moment trading near its previous resistance level. The RSI line is moving around 60.49, while the 14 SMA is around point 46.40 points near the median line. The RSI line is predicted to see a bearish decline in the near future.
The Stochastic RSI is indicating a bearish reversal from the overbought levels. The %K line is in the initial stage of a negative interception. The current value of stochastic RSI is 98.49 points.
Conclusion
Presently the price of THETA is providing a good opportunity to capture the predictable moments made in the consolidation at the 4Hr time frame. It is taking resistance from the 100 EMA. If they are successful in diverting the trend of the price it can take a bearish correction of 6% within a few days according to the shorter timeframe.
Technical levels –
Support -$0.939
Resistance – $1.000
Disclaimer
The views and opinions stated by the author, or any people named in this article, are for informational purposes only, and they do not establish financial, investment, or other advice. Investing in or trading crypto assets comes with a risk of financial loss.


 Bitcoin
  Ethereum
  Tether
  USDC
USDC  Dogecoin
  Cardano
  Bitcoin Cash
  Polygon
  Litecoin
  LEO Token
  Hedera
  Stellar
  Cosmos Hub
  OKB
OKB  Maker
Maker  Algorand
  NEO
NEO  Gate
Gate  Synthetix Network
  KuCoin
  IOTA
IOTA  Tether Gold
  TrueUSD
  Holo
Holo  Enjin Coin
  Ravencoin
  0x Protocol
  Siacoin
  Basic Attention
  Ontology
  Zcash
Zcash  Decred
  Lisk
Lisk  Waves
Waves  DigiByte
  Status
  Numeraire
  Nano
Nano  Pax Dollar
  Steem
Steem  OMG Network
  BUSD
BUSD  Ren
Ren  Bitcoin Diamond
  Bytom
Bytom  HUSD
HUSD  Energi
  Augur
Augur