


Top 3 Cryptocurrencies To Invest Amid Market Correction; Best Picks for May 2023

Over the last few days, the crypto market as a whole has witnessed significant selling pressure and caused a correction phase in several major cryptocurrencies. However, with the overall market trend still bullish, here are some of the top coins offering discount opportunities before the next recovery cycle begins
Cardano (ADA)
Source- Tradingview
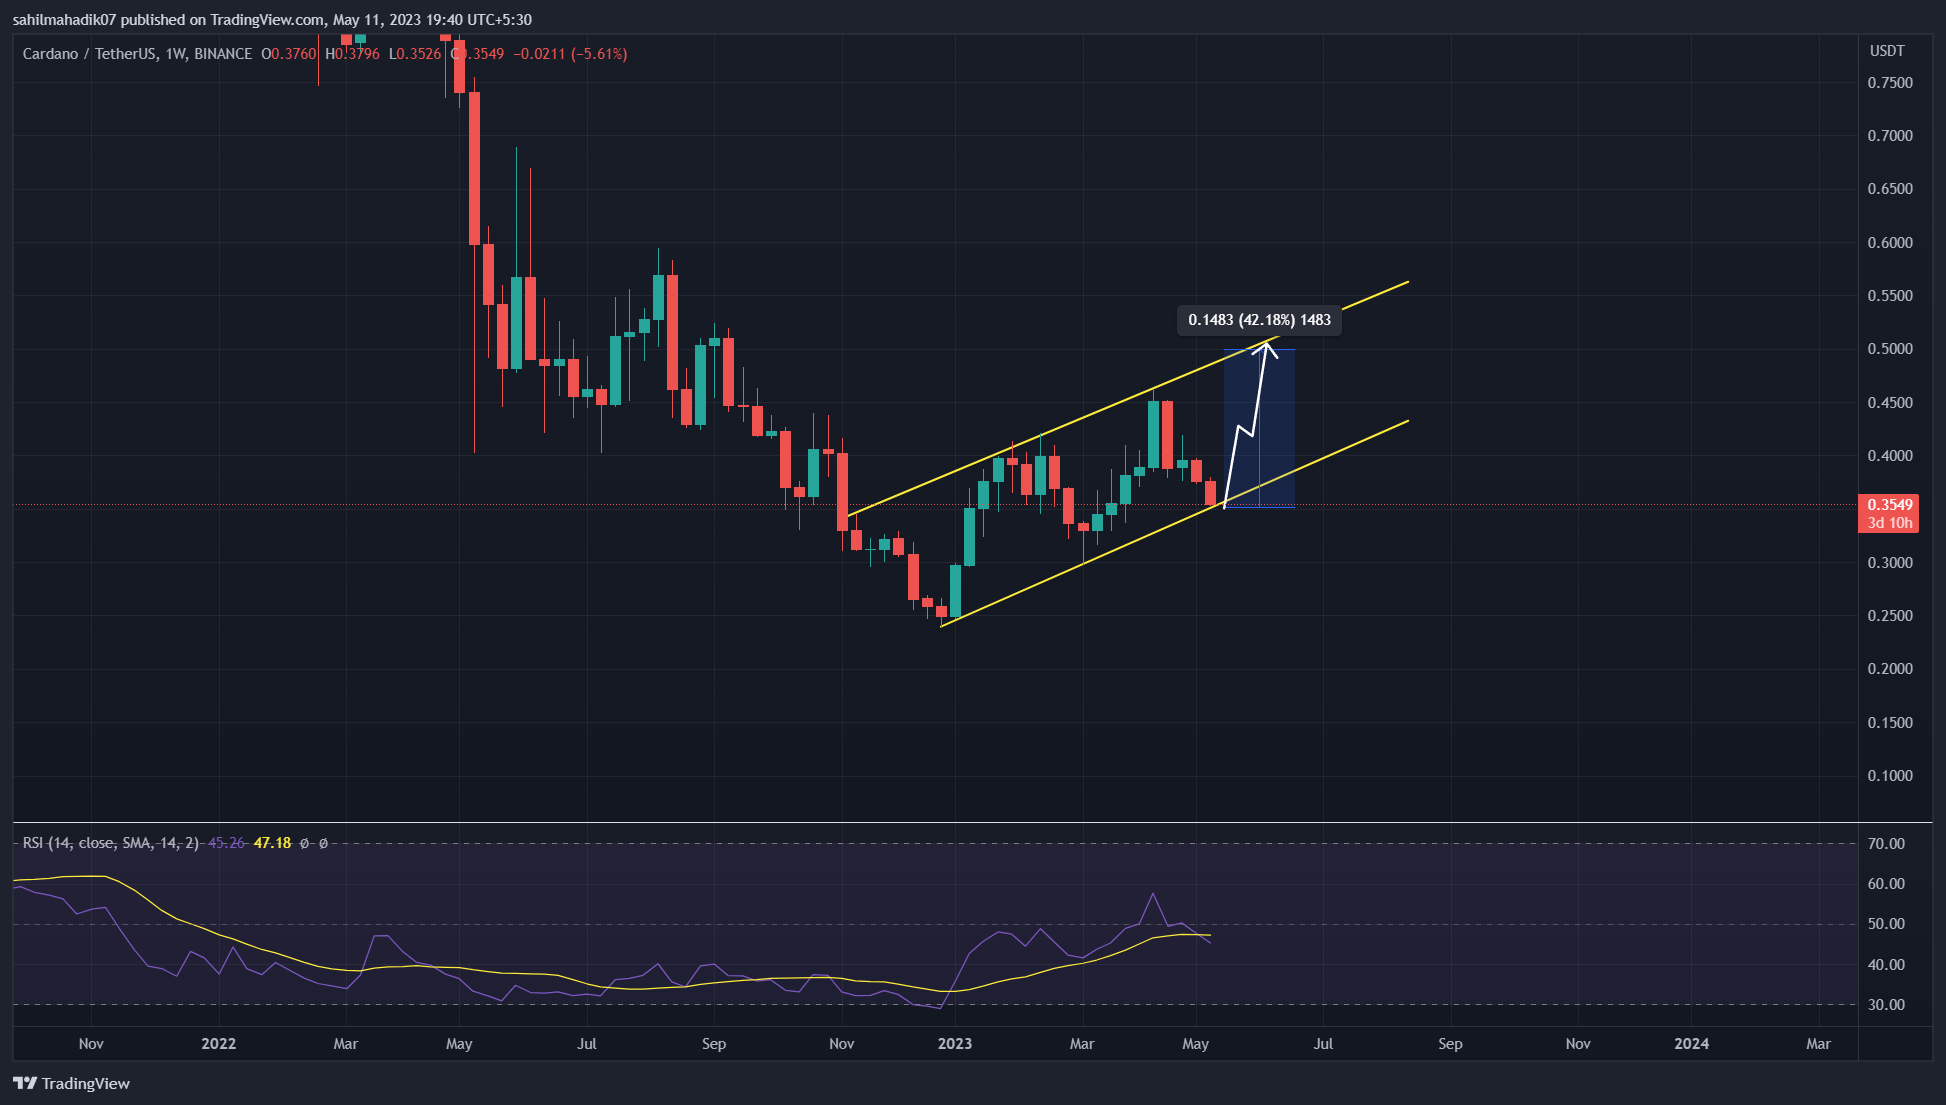
In the weekly time frame chart, the Cardano coin price shows a set of new higher highs and higher lows reflecting an early sign of trend reversal. If we join the peak of these price swings we can see the formation of a rising channel pattern.
This pattern showcases two rising trendlines within which the price witnessed a sustained rally. Amid the recent selling pressure in the market, the ADA price plunged to the pattern’s support trendline offering a bullish reversal opportunity if the buyers manage to sustain this level.
By the press time, the Cardano price trades at $0.35, but with a potential rally to may rise 42% higher to the resistance trendline at $0.5
Litecoin (LTC)
Source- Tradingview
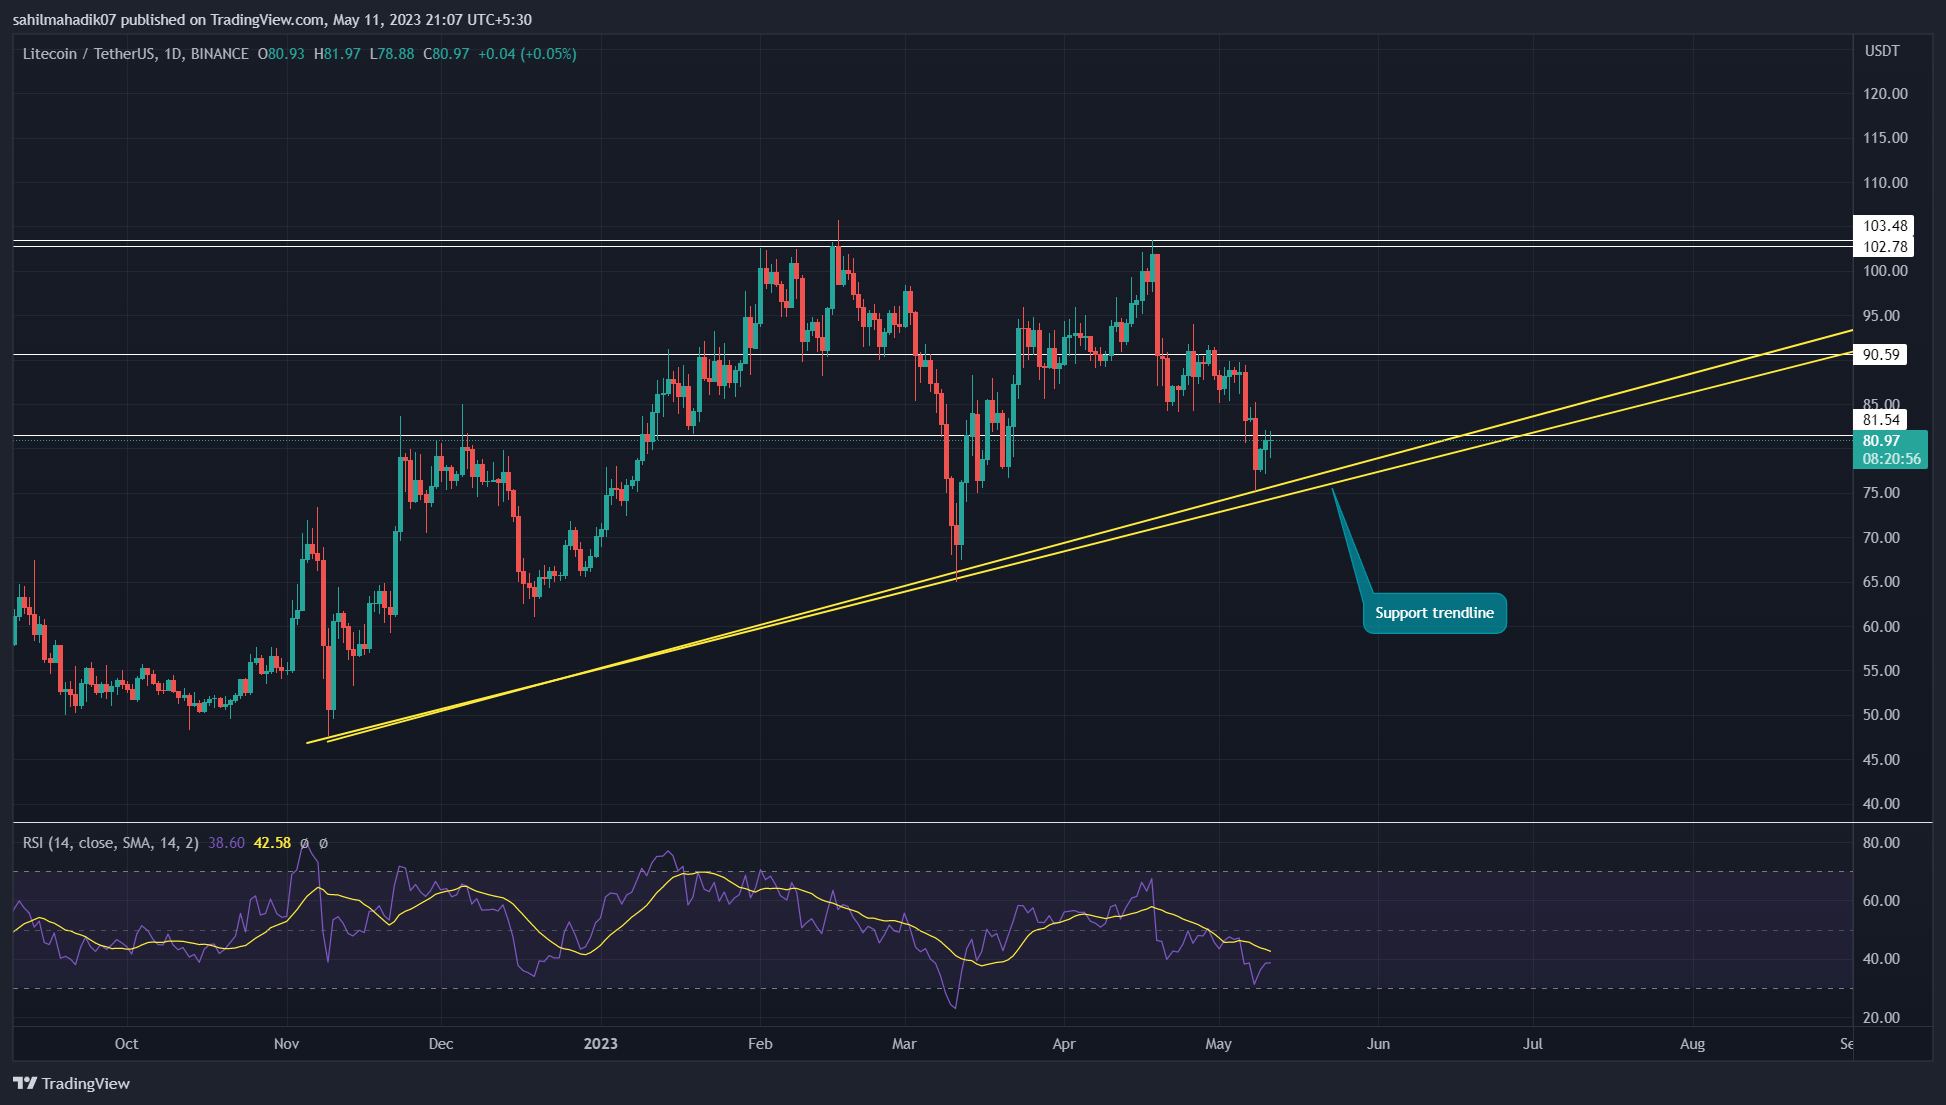
The daily time frame chart shows that the Litecoin price has been using a support trendline to carry its ongoing bullish rally. A pullback to this support is offering buyers strong support to accumulate and replenish the bullish momentum.
As of now, LTC price trades at $81.15 and shows a reversal sign of the rising support with lower price rejection candles. If the coin price manages to breach the immediate resistance of $81.5, the buyers will gain an additional launchpad which can surge Litecoin’s market value 26% higher to hit the monthly barrier of $103-$102.5.
Anyhow, a breakout above the aforementioned barrier is crucial to witness the further rally.
Also Read: Top 10 New Meme Coins With The Best Potential In 2023
Cosmos(ATOM)
Source- Tradingview
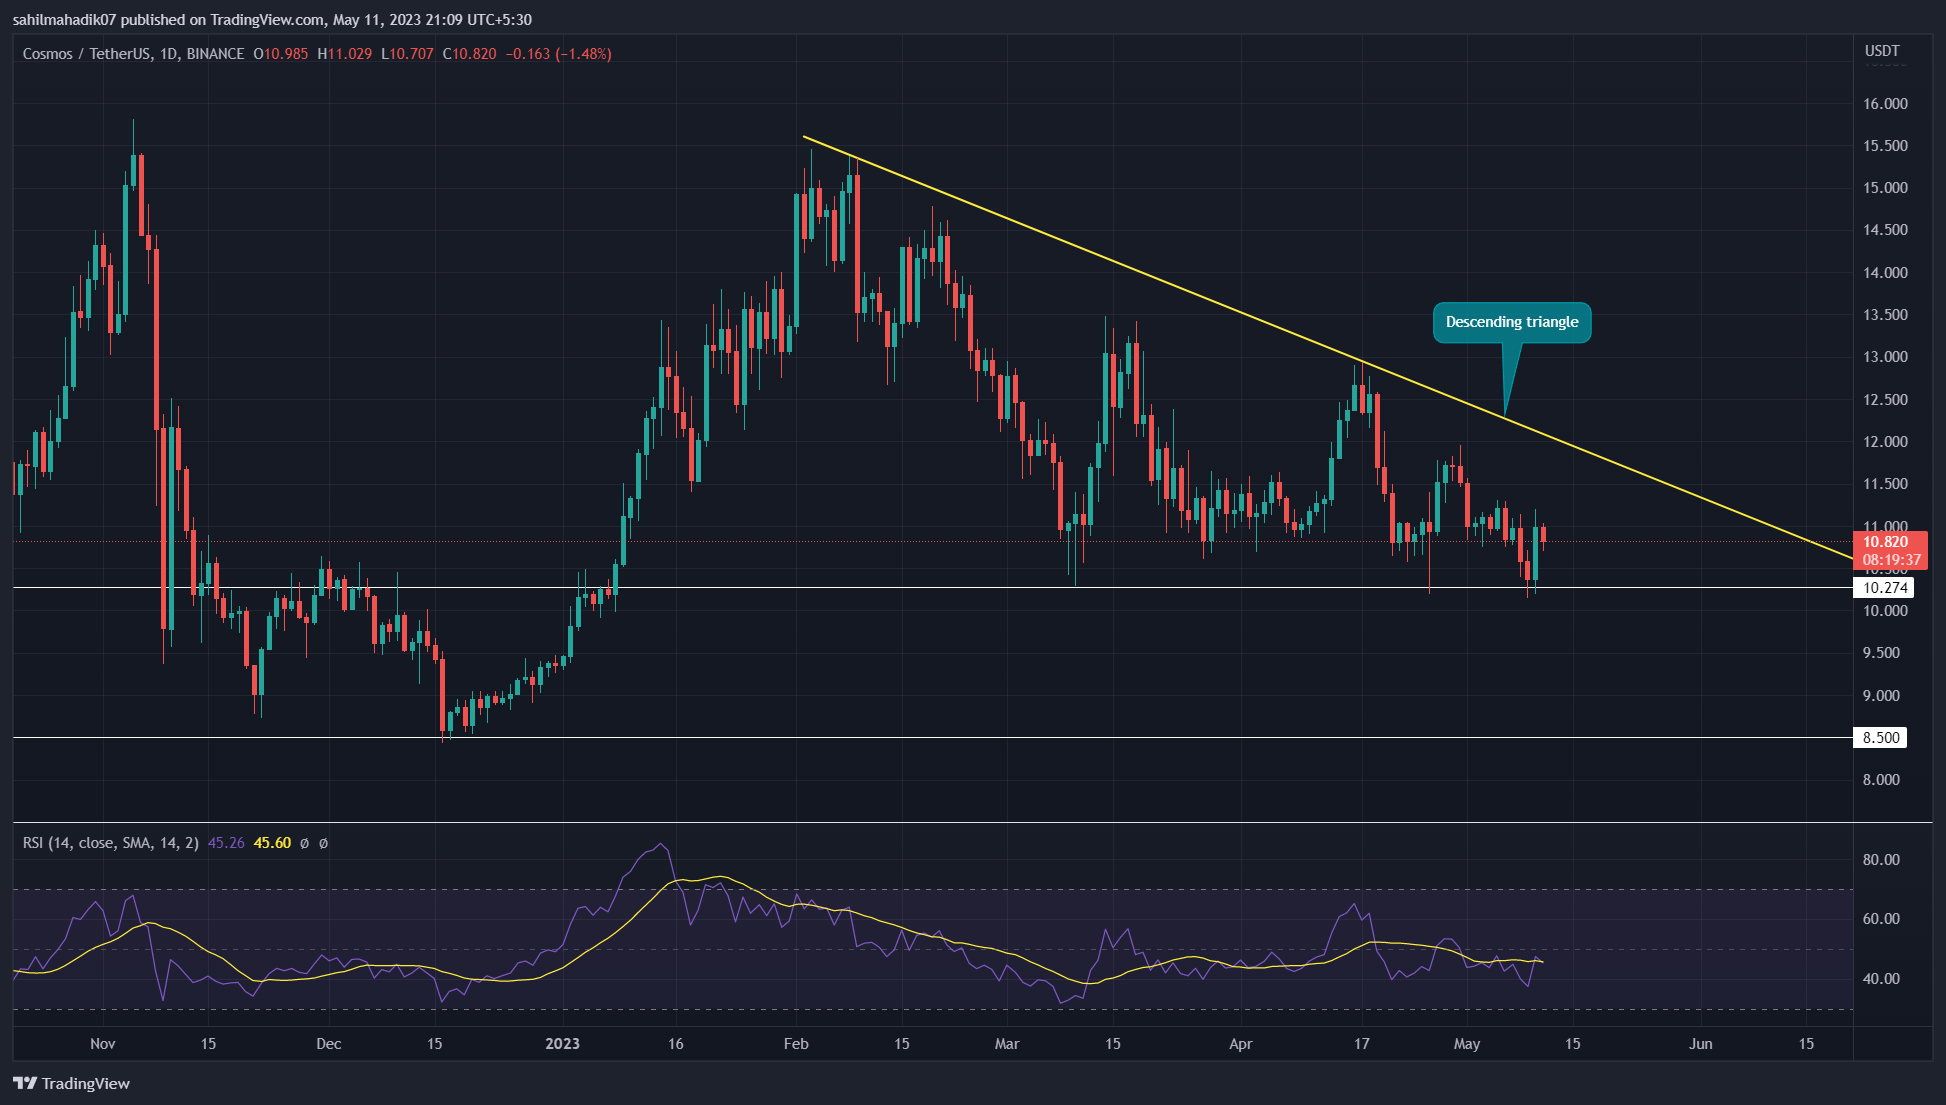
The Cosmos coin price shows the formation of a descending triangle pattern in the daily time frame chart. Under the influence of the bearish continuation pattern, the sellers are likely to breach the key neckline support of $10.3 which may further encourage the downfall
However, the daily RSI indicator rising suggests the underlying bullish momentum is increasing. The bullish divergence in this strength indicator suggests a significant possibility of a breakout above the overhead trendline.
This breakout will undermine the bearish thesis and may bolster buyers to drive ATOM price 43% higher to hit a $15.45 peak.


 Bitcoin
  Ethereum
  Tether
  USDC
USDC  Dogecoin
  Cardano
  Bitcoin Cash
  Polygon
  Litecoin
  LEO Token
  Hedera
  Cosmos Hub
  Stellar
  OKB
OKB  Maker
Maker  Algorand
  NEO
NEO  Gate
Gate  KuCoin
  Synthetix Network
  IOTA
IOTA  Tether Gold
  TrueUSD
  Enjin Coin
  Holo
Holo  Ravencoin
  0x Protocol
  Siacoin
  Basic Attention
  Zcash
Zcash  Decred
  Ontology
  Lisk
Lisk  Waves
Waves  DigiByte
  Numeraire
  Nano
Nano  Status
  Pax Dollar
  Steem
Steem  OMG Network
  BUSD
BUSD  Ren
Ren  Bitcoin Diamond
  Bytom
Bytom  Energi
  HUSD
HUSD  Augur
Augur