


Top 3 Cryptocurrencies with Bullish Pattern could Explode in June

The cryptocurrency market recently witnessed a sudden surge in buying pressure mostly under the influence of macroeconomic events such as the US debt ceiling deal. Amid this recovery, several crypto coins are getting back on the recovery track to reclaim lost ground. Thus, today we’ll analyze the top cryptocurrencies with a bullish pattern that can offer massive growth amid the anticipated recovery rally of June.
Also Read: Debt Ceiling Deal Blocks 30% Proposed Tax On Crypto Mining, Confirms Congressman
Solana(SOL)

Source- Tradingview
During the last five weeks’ correction phase, the Solana price strictly resonated between two converging trendlines of the wedge pattern. The trendlines gradually closing together reflect the sellers are losing momentum which eventually to buyers retaking trendline control.
Thus, on May 27th, the SOL price gave a massive breakout from the pattern’s resistance trendline indicating a positive switch in market sentiment. As of now, the SOL price trades at $20.5, with an intraday loss of 1.39%.
If the coin price manages to sustain above the breached trendline, the buyers may drive the prices to a possible target of $24 or $26, registering a max gain of 27%.
Chainlink(LINK)
Source- Tradingview
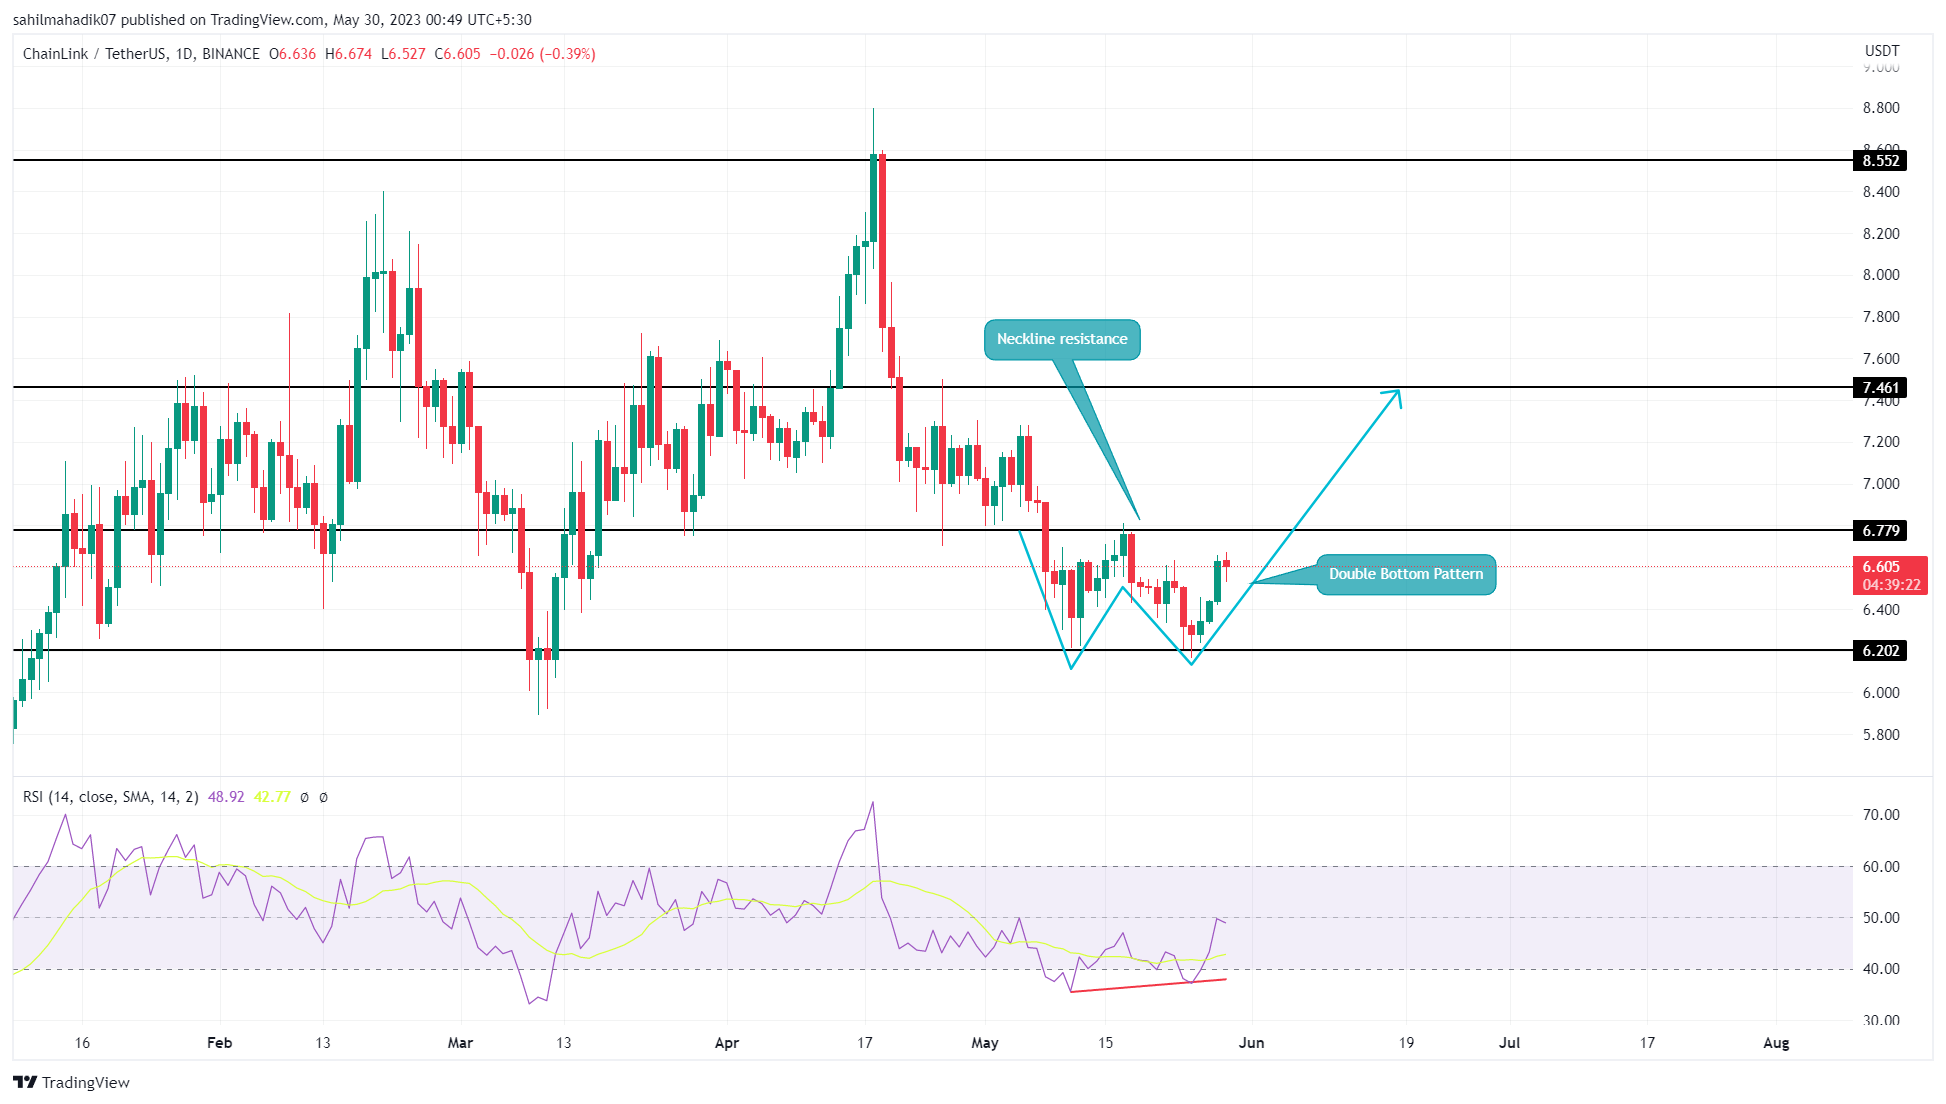
Amid the recent volatile phase in the crypto market, the sideways trend of Chainlink price suitable support at $6.2. Using this level as the base support, the LINK price shows the formation of a double bottom pattern in the daily time frame chart.
This pattern accumulates bullish momentum and often triggers a significant rally upon the breakout of its resistance neckline. Currently, the chainlink price traders $6.59, but under the influence of this pattern, the price should reach the overhead resistance of $6.68.
If buyers could successfully flip this barrier into potential support, this altcoin would rise another 10% to hit the $7.47 mark, followed by $8.5 and $9.5.
Cosmos(ATOM)
Source- Tradingview
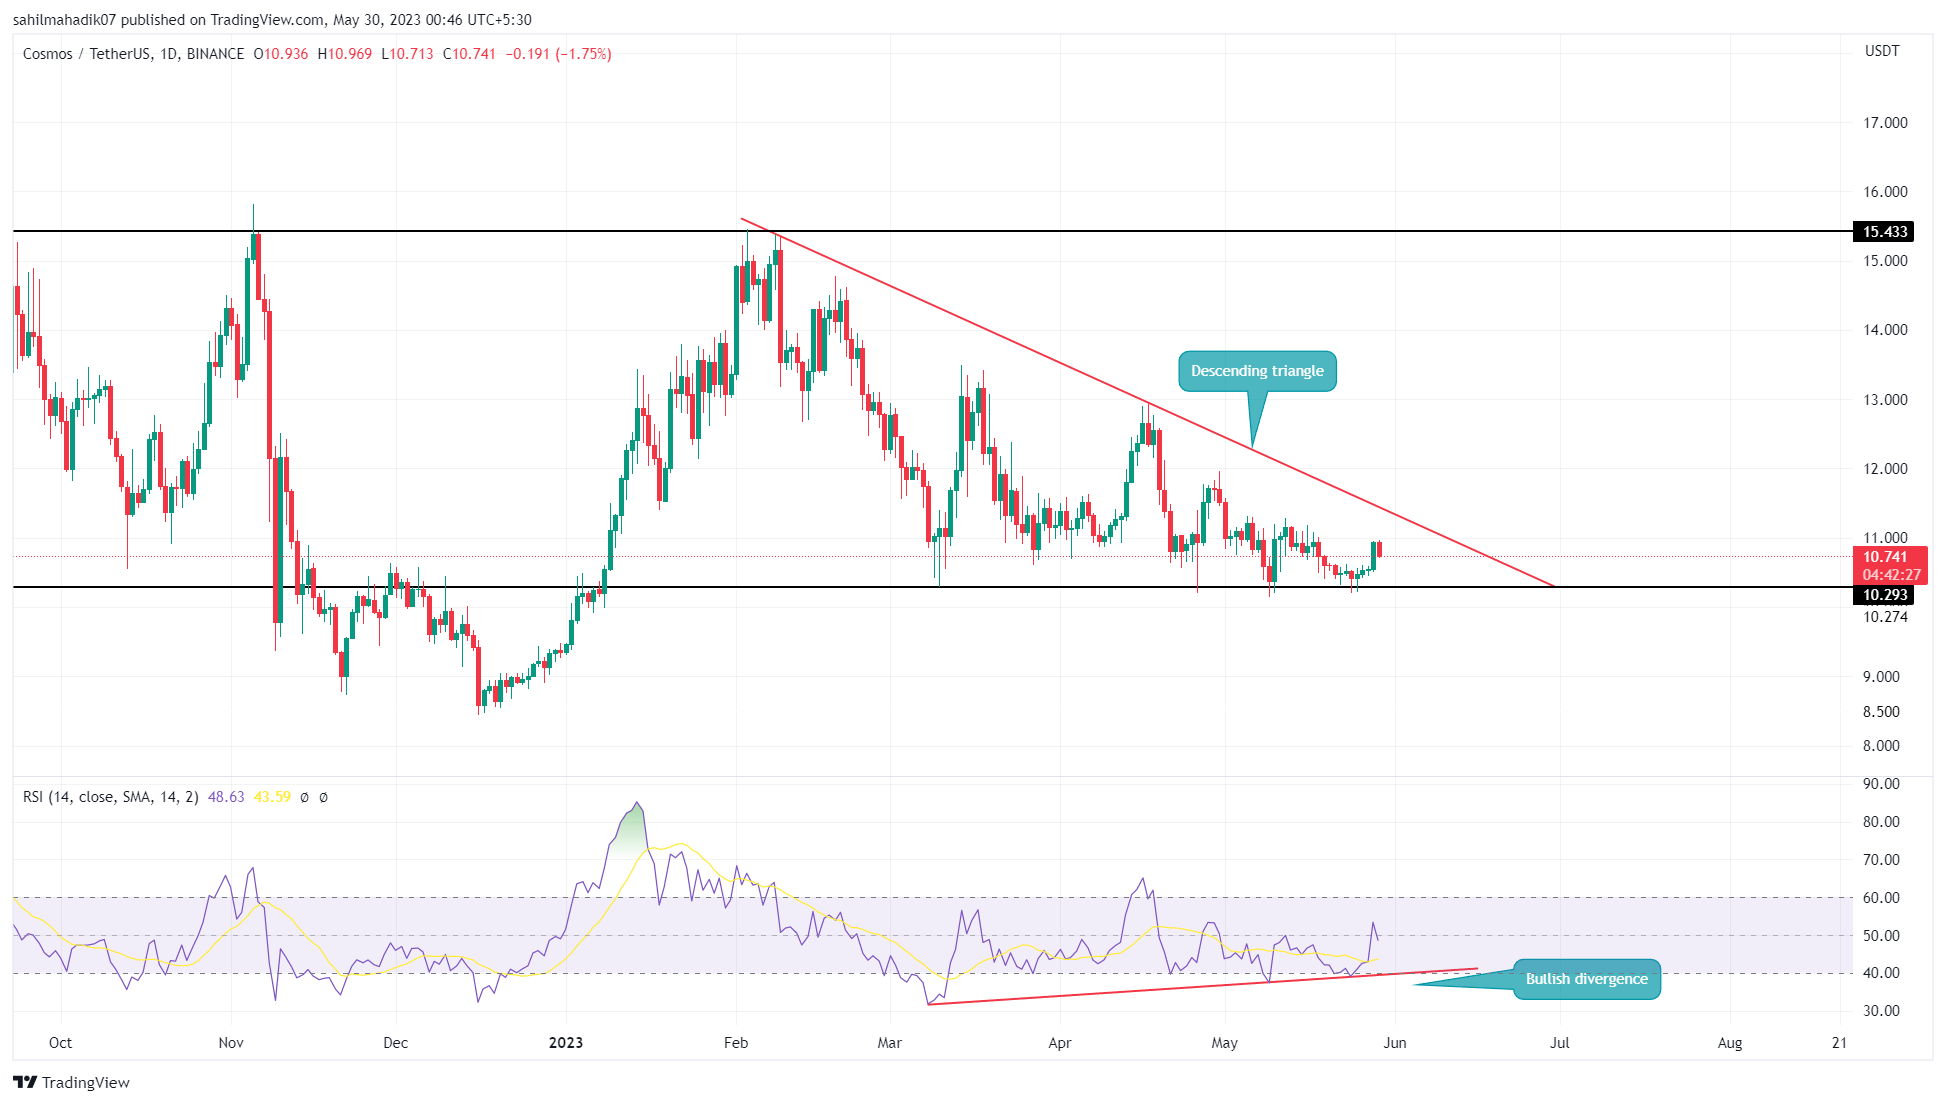
In the daily time frame chart, the Cosmos coin shows the formation of a descending triangle pattern. Though in theory, this pattern is a downtrend continuation pattern, the RSI indicator which reflects the momentum of the asset’s recent price is rising higher.
This bullish divergence indicates the underlying bullish momentum is growing, and thus, the ATOM price also holds the possibility to breach the overhead trendline. A bullish breakout from this barrier with a daily candle closing will drive the price 43% higher to hit $15.4.


 Bitcoin
  Ethereum
  Tether
  USDC
USDC  Dogecoin
  Cardano
  Bitcoin Cash
  Polygon
  Litecoin
  LEO Token
  Hedera
  Cosmos Hub
  Stellar
  OKB
OKB  Maker
Maker  Algorand
  NEO
NEO  Gate
Gate  KuCoin
  Synthetix Network
  IOTA
IOTA  Tether Gold
  TrueUSD
  Enjin Coin
  Holo
Holo  Ravencoin
  0x Protocol
  Siacoin
  Basic Attention
  Decred
  Zcash
Zcash  Ontology
  Lisk
Lisk  Waves
Waves  DigiByte
  Nano
Nano  Status
  Numeraire
  Pax Dollar
  Steem
Steem  OMG Network
  BUSD
BUSD  Ren
Ren  Bitcoin Diamond
  Bytom
Bytom  HUSD
HUSD  Energi
  Augur
Augur