


Traders Fear Collapse as Solana (SOL) Price Falls Below $20
Solana (SOL) price broke down from a short-term structure, potentially warning of a deeper correction.
SOL is the native token of the Solana blockchain, created by Anatoly Yakovenko. The SOL price has fallen under a long-term descending resistance line since reaching an all-time high price of $259.90 in November 2021. The downward movement led to a low of $8 in December 2022.
The SOL token price bounced sharply afterward, increasing by 230% in January 2023. However, it failed to break out above the $27 resistance area (red icon). This is a crucial level since it previously acted as support since March 2021. Therefore, it is now expected to provide significant resistance.
Moreover, the area will soon coincide with the long-term descending resistance line outlined above.
Finally, the weekly RSI has also found resistance at the 50 line, which is common in breakdowns and retests. So, the trend can only be considered bullish once the Solana price breaks out from the $27 resistance area and the descending resistance line. In that case, a movement to $47 could follow.
However, if the rejection continues, the SOL price could fall to single digits again.

SOL/USDT Weekly Chart. Source: TradingView
Will Solana (SOL) Price Maintain Bullish Structure?
The technical analysis from the daily time frame shows that the SOL price trades at a very crucial level at the minor support of $20.30. Whether the price breaks down from this area will be crucial in determining the future trend.
If it does, it would mean that the previous breakout was illegitimate. Moreover, it would do the same for the RSI, which broke out from its own bearish divergence trend line (green line). Then, the RSI would fall below 50, and the price could fall to the $17.60 support area. This breakdown could occur in the next 24 hours.
On the other hand, a bounce and the creation of a higher low could lead to another attempt at breaking out from the long-term resistance line.
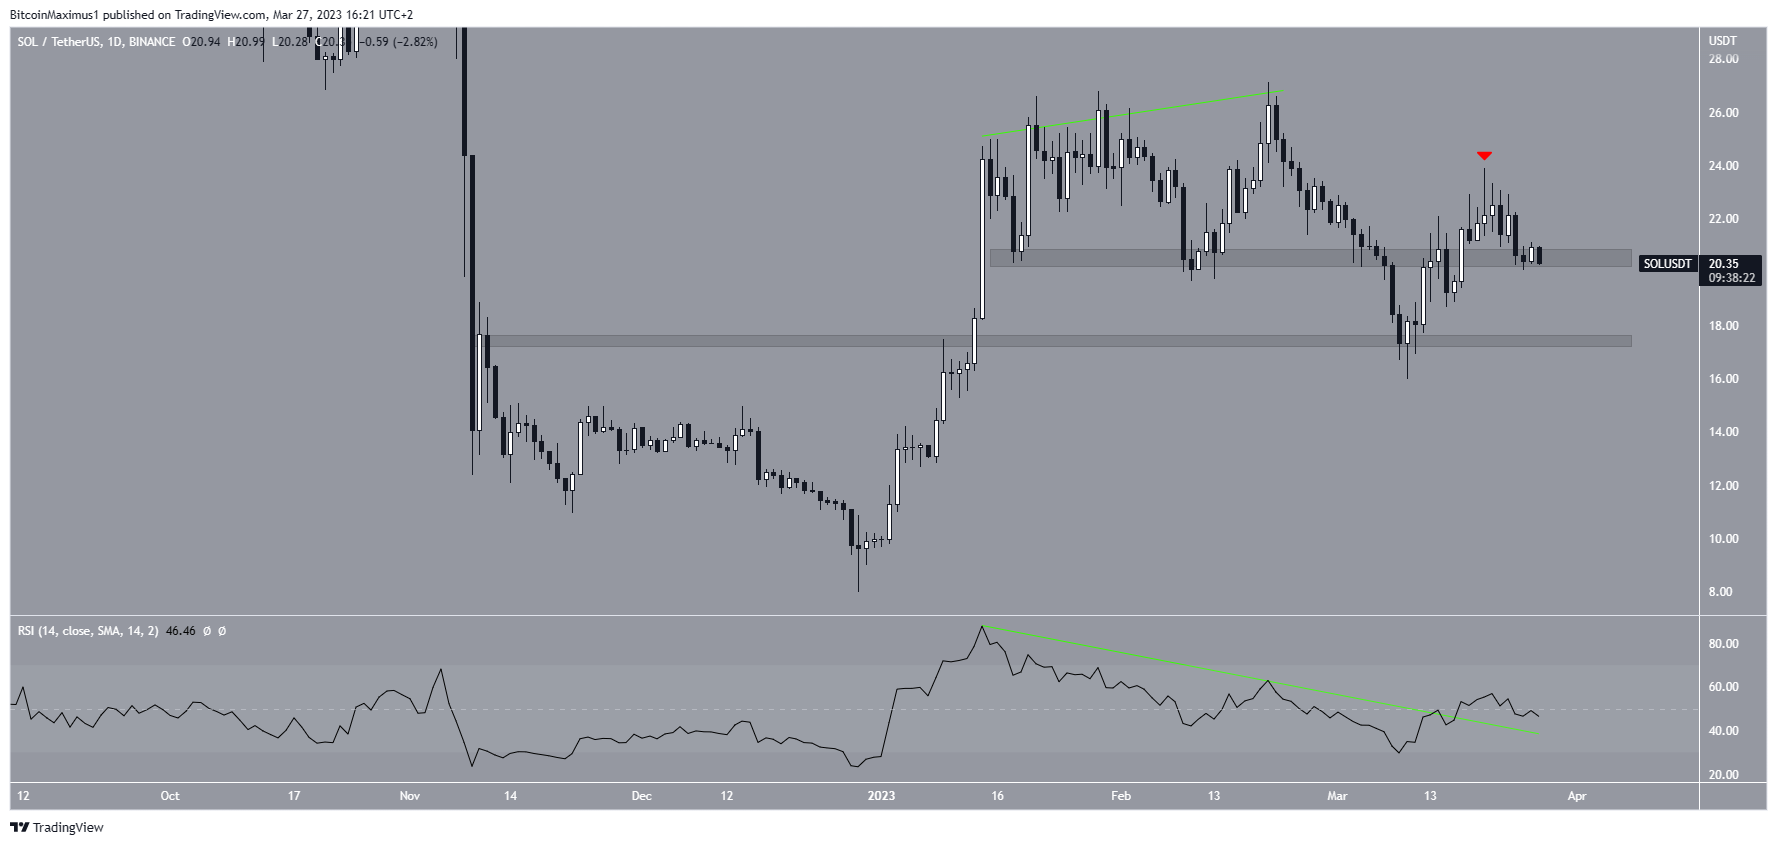
SOL/USDT Daily Chart. Source: TradingView
Finally, the short-term six-hour time frame shows that the SOL price broke down from an ascending parallel channel. Since channels usually contain corrections, it supports the possibility of further downside.
As a result, the most likely wave count suggests that SOL is in the C wave of an A-B-C corrective structure (black). Giving waves A:C a 1:1 ratio would lead to a low of $12.90. Since this coincides with the 0.786 Fib retracement support level (white) at $12.10, the entire $12-$13 area can be considered support.
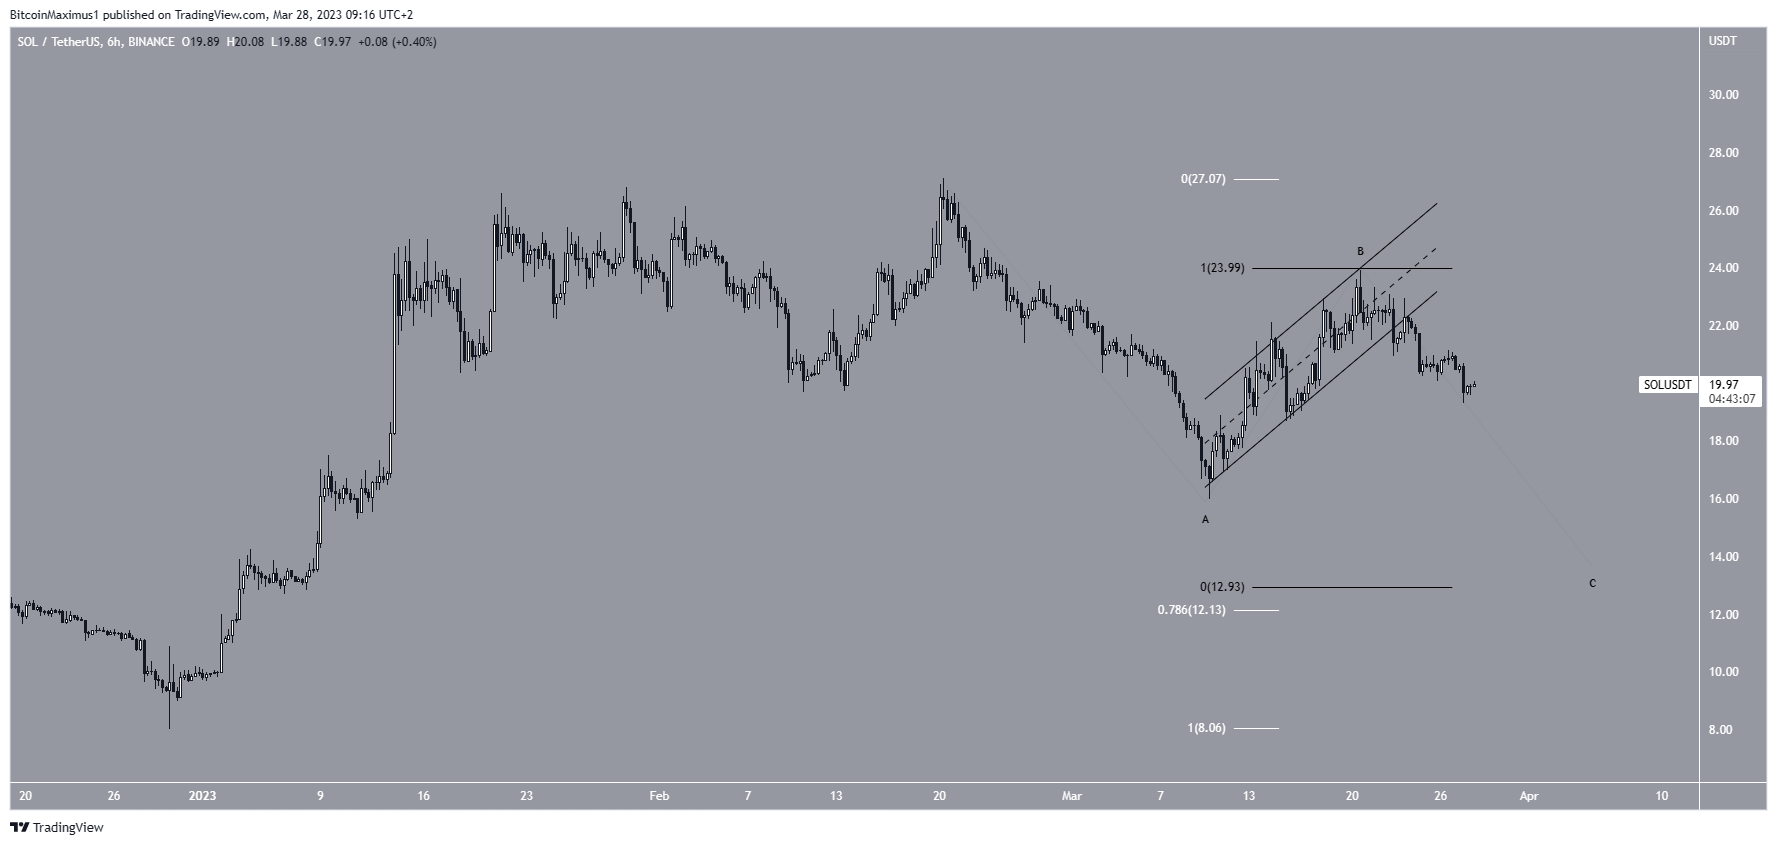
SOL/USDT Six-Hour Chart. Source: TradingView
To conclude, the most likely Solana price forecast is the continuation of the decrease toward $12-$13. Whether the price will fall further is still unclear. On the other hand, a movement above $27 would invalidate this bearish forecast and could catalyze an increase to $47.
For BeInCrypto’s latest crypto market analysis, click here.


 Bitcoin
  Ethereum
  Tether
  USDC
USDC  Dogecoin
  Cardano
  Bitcoin Cash
  Polygon
  Litecoin
  LEO Token
  Hedera
  Cosmos Hub
  Stellar
  OKB
OKB  Maker
Maker  Algorand
  NEO
NEO  Gate
Gate  KuCoin
  Synthetix Network
  IOTA
IOTA  Tether Gold
  TrueUSD
  Enjin Coin
  0x Protocol
  Ravencoin
  Holo
Holo  Siacoin
  Basic Attention
  Zcash
Zcash  Decred
  Ontology
  Lisk
Lisk  Waves
Waves  DigiByte
  Numeraire
  Nano
Nano  Pax Dollar
  Status
  Steem
Steem  OMG Network
  BUSD
BUSD  Ren
Ren  Bytom
Bytom  Bitcoin Diamond
  HUSD
HUSD  Augur
Augur  Energi