


Tron Price Analysis: Token faces rejection from supply zone again, what’s next?

- The token is trading above the 200 EMA on the daily time frame.
- The pair of TRX/USDT is trading at the price level of $0.062 with a gain of 0.51% in the past 24 hours.
The token has shown bullish momentum in the past few weeks with bulls driving up the price of the token. The bears are successful in holding the $0.064 level and are not letting the bulls to break above the level.
Tron token on the daily chart
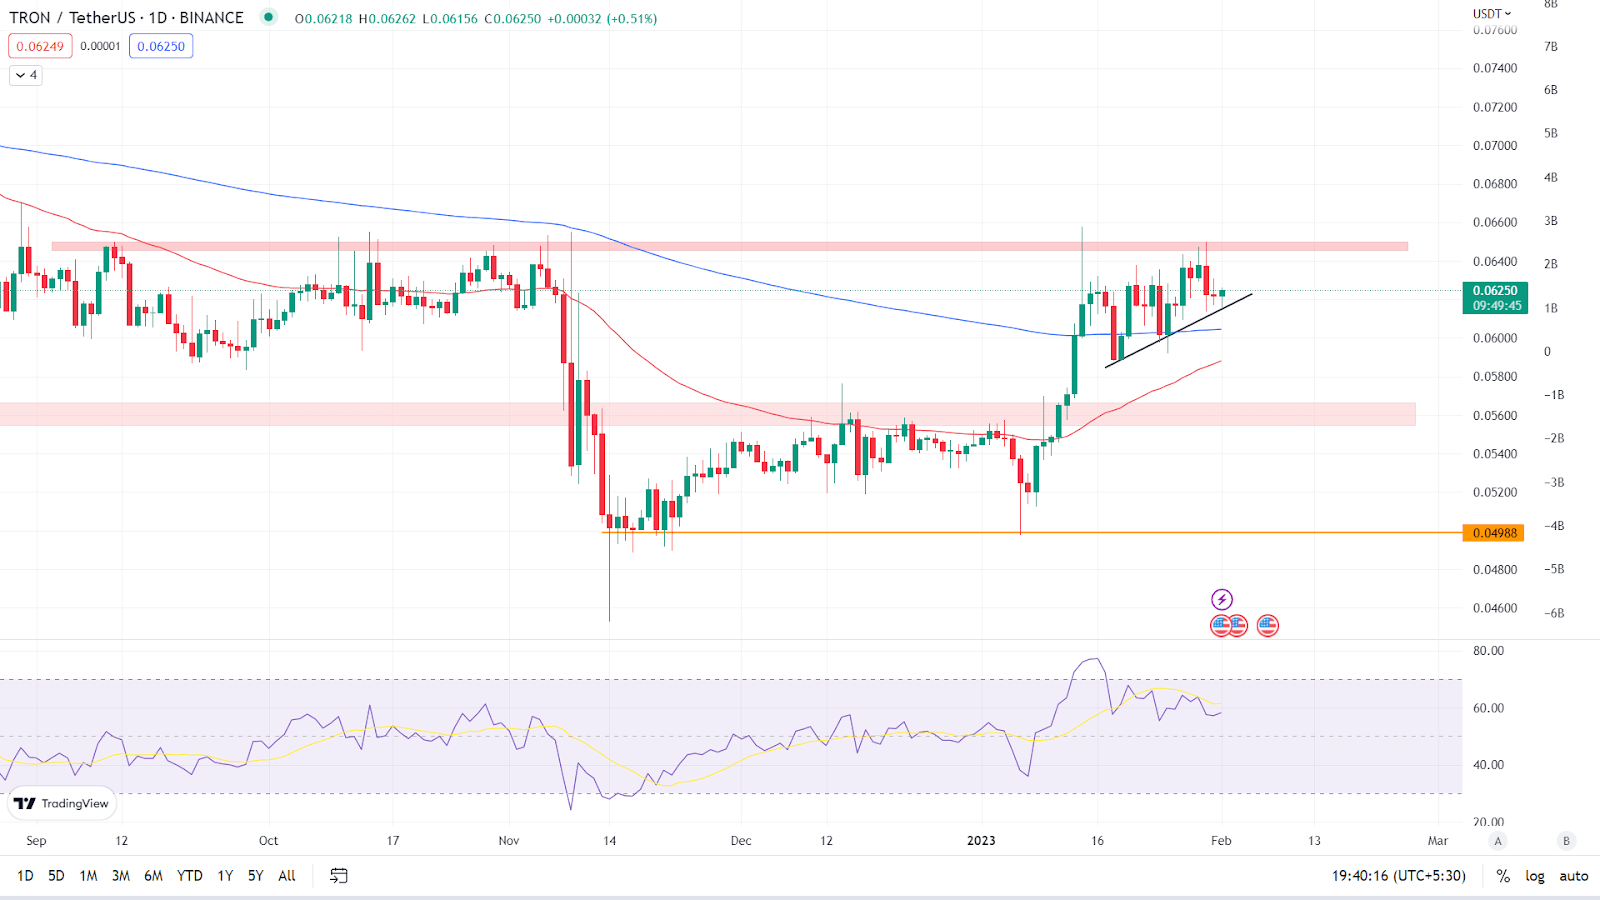
Source: TradingView
On the daily time frame, the token bounced off strongly from the demand zone, forming strong bullish candles. According to the daily chart, Tron token is currently trading at $0.062, up 0.51% in the last 24 hours. The token has crossed and sustained above the 200 EMA and is trading above its key Moving Averages, the 50 EMA and the 200 EMA. (Red line is 50 EMA and the blue line is 200 EMA). It remains to be seen whether the token can bounce off the 200 EMA and break above the supply zone.
Relative Strength Index: The asset’s RSI curve is currently trading at 57.02 and is dropping in value as the token’s price declines following rejection from the supply zone. The RSI curve has crossed the 14 SMA downward due to the token’s value fall. If the bulls are unable to gain momentum and continue to lose value, sliding below the 200 EMA, the RSI curve’s value will fall even further.
Analyst view & Expectations
In the daily time frame, the token is forming an upward trend line, and in order to break above the supply zone, the token should continue trading on the trend line. Investors are advised to wait for the token to break above the $0.064 resistance level before buying to gain more insight on the trend’s direction. Intraday traders, on the other hand, have a good opportunity to trade in both directions; if the token breaks the trend line downward, they can go short; if it breaks above the resistance level, they can go long and book profits based on their risk to reward ratio.
According to our current TRON price forecast, the value of TRON is expected to fall by -5.21% and hit $ 0.058 in the coming days. Our technical indicators indicate that the current sentiment is Neutral, with the Fear & Greed Index reading 56. (Greed). TRON had 16/30 (53%) green days with 6.24% price volatility in the previous 30 days. According to our TRON forecast, now is not the time to buy TRON.
Technical Levels
Major support: $0.060 & 200 EMA on the daily chart
Major resistance: $0.064
Conclusion
The token is now facing rejection and forming a bearish chart pattern because it has been unable to provide a breakout above the supply zone. Before acting, investors should wait for a clear indication.
Disclaimer: The views and opinions stated by the author, or any people named in this article, are for informational ideas only, and they do not establish the financial, investment, or other advice. Investing in or trading crypto assets comes with a risk of financial loss.


 Bitcoin
  Ethereum
  Tether
  USDC
USDC  Dogecoin
  Cardano
  Bitcoin Cash
  Polygon
  Litecoin
  LEO Token
  Hedera
  Cosmos Hub
  Stellar
  OKB
OKB  Maker
Maker  Algorand
  NEO
NEO  Gate
Gate  KuCoin
  Synthetix Network
  IOTA
IOTA  Tether Gold
  TrueUSD
  Enjin Coin
  Holo
Holo  Ravencoin
  0x Protocol
  Siacoin
  Basic Attention
  Zcash
Zcash  Decred
  Ontology
  Lisk
Lisk  Waves
Waves  DigiByte
  Nano
Nano  Numeraire
  Status
  Pax Dollar
  Steem
Steem  OMG Network
  BUSD
BUSD  Ren
Ren  Bitcoin Diamond
  Bytom
Bytom  HUSD
HUSD  Energi
  Augur
Augur