


Weekly RSI at an All-Time Low: What Does It Mean for Stellar (XLM) Price?

The Stellar Lumens (XLM) price is approaching the end of a bullish pattern that has been in place for nearly 18 months. A positive resolution could kickstart a bullish reversal.
Stellar is a decentralized network created by the Stellar Development Foundation. The native crypto asset for the Stellar network is XLM. The XLM price is nearing the end of a bullish pattern that has been in place since May 2021. Therefore, a decisive movement is expected soon.
Long-Term Stellar Price Pattern
The Stellar price has moved downwards inside a descending wedge since reaching a high of $0.798 in May 2021. The descending wedge is considered a bullish pattern, meaning that it leads to breakouts most of the time.
However, there are no other bullish signs beside the presence of the descending wedge.
Firstly, the XLM price broke down from the $0.084 horizontal support area in the beginning of December. This led to a minimum price of $0.070 on Dec. 27, the lowest price in two years.
Secondly, the weekly RSI broke down from its bullish divergence trendline (green line) right before the XLM price breakdown. This is a sign that is often associated with bearish trends. But, the RSI has now crossed into oversold territory and reached an all-time low of 29 (red icon) this week.
If the decrease continues, there is horizontal support at $0.062. Depending on when the XLM price reaches it, the area could coincide with the support line of the wedge.
As a result, the most likely Stellar price prediction for January is consolidation inside the wedge. A reclaim of the $0.084 resistance area could mean that a bullish reversal has begun since it would also create a breakout from the descending wedge.
Conversely, a weekly close below the $0.062 support area could lead to a Stellar lumens price collapse.
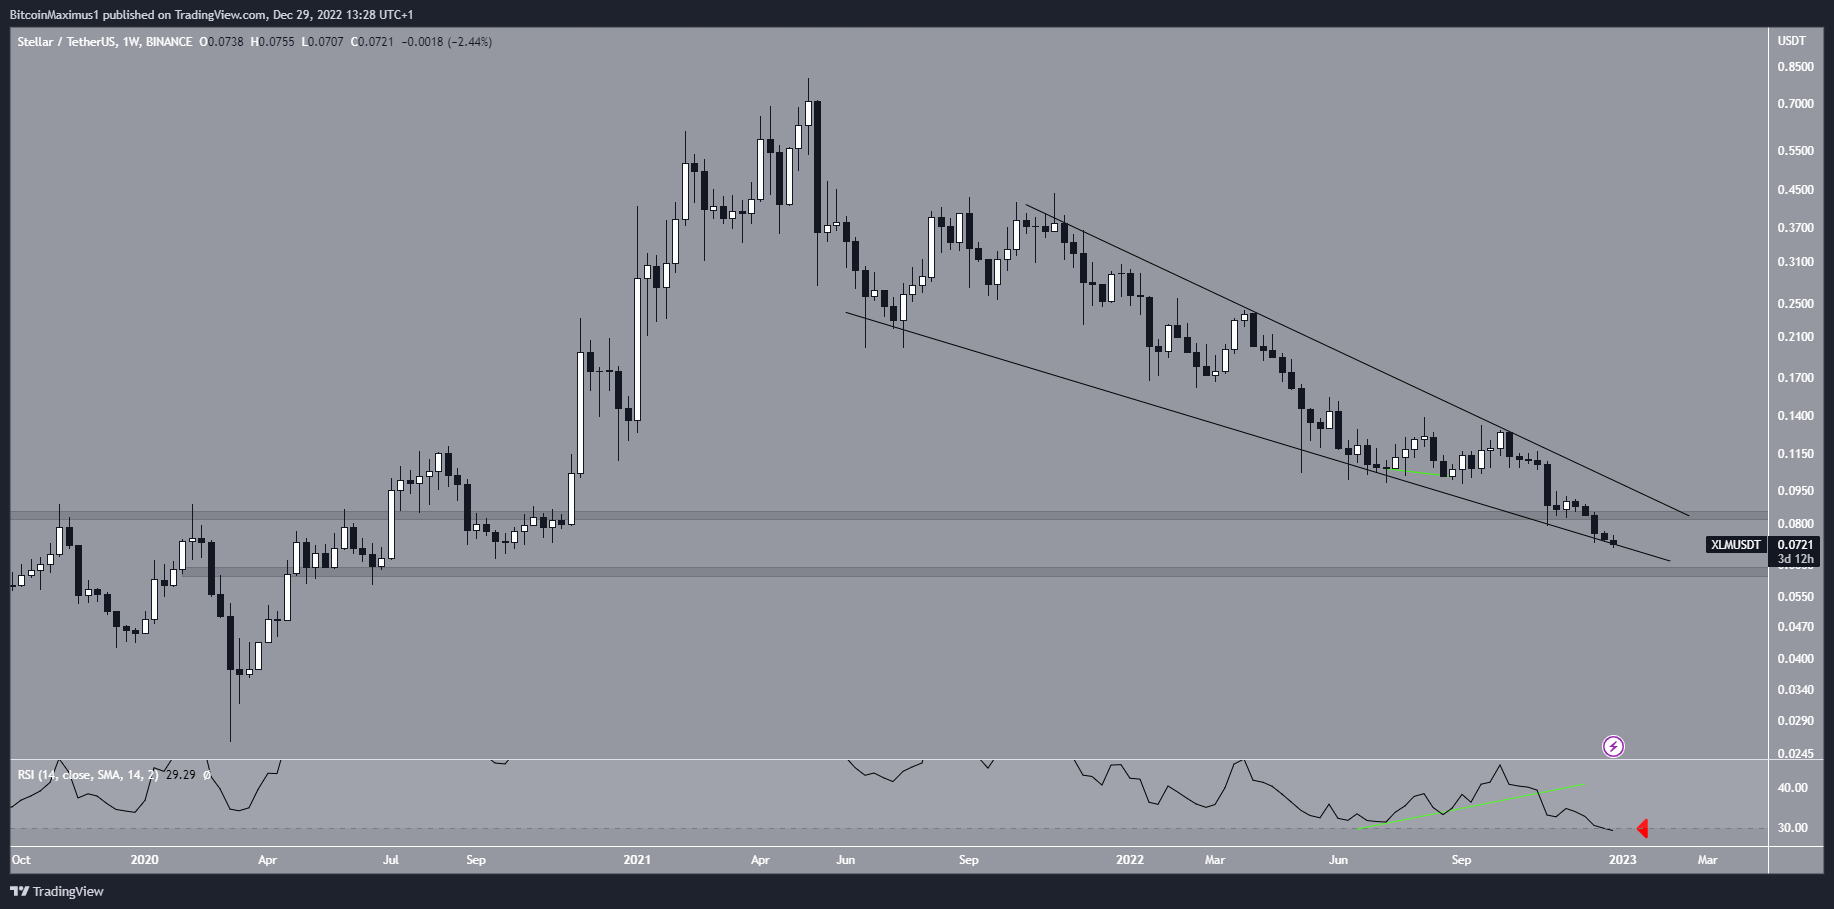
XLM/USDT Weekly Chart. Source: TradingView
Stellar Price Prediction For January
The daily chart is more bullish than the weekly one. The main reason for this is the extremely bullish outlook given by the daily RSI.
The indicator has generated two instances of bullish divergences, both long – (green) and short- (white) term. Such signs often precede bullish trend reversals. Since they are transpiring at the support line of a bullish pattern, they make a bullish reversal even more likely.
If one occurs, the XLM price would be expected to increase toward the resistance line of the wedge, which also coincides with the $0.084 resistance area.
On the other hand, a daily close below the wedge’s support line would indicate that the trend is bearish instead.
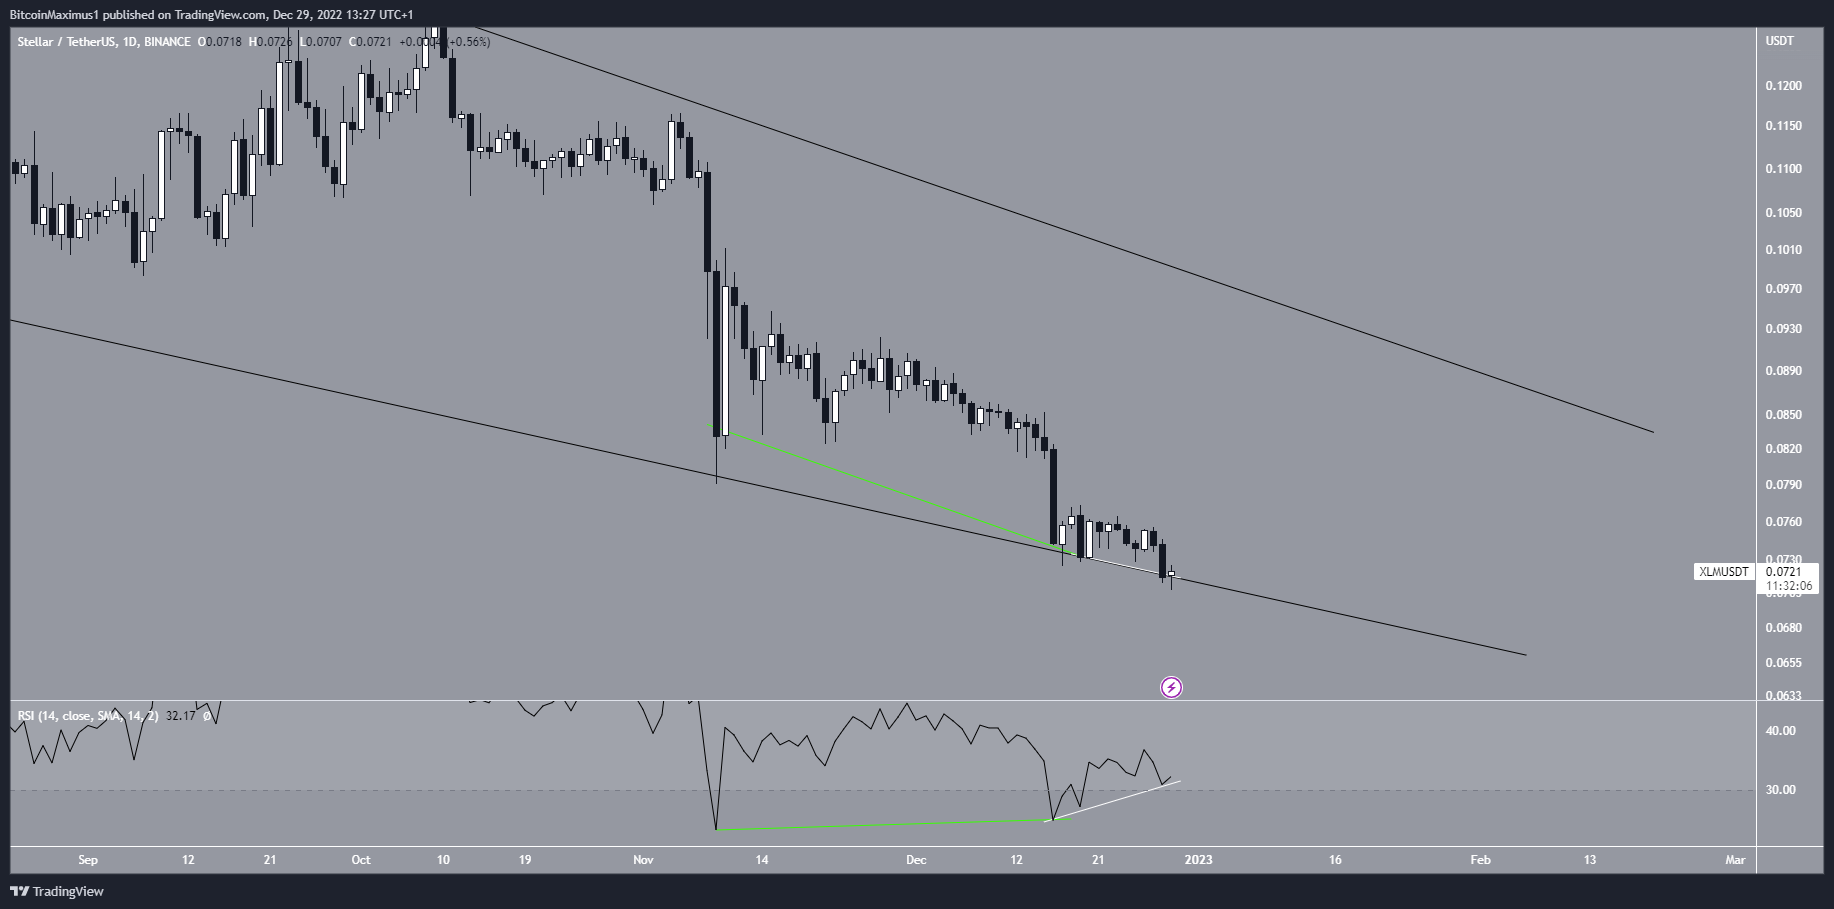
XLM/USDT Daily Chart. Source: TradingView
To conclude, the weekly readings do not yet confirm the possibility of a bullish reversal, though they are extremely oversold. However, the daily time frame analysis suggests that an upward movement could transpire in the near future. A breakout from $0.084 would confirm the bullish XLM price forecast while a fall below $0.062 would suggest that the trend is bearish.


 Bitcoin
  Ethereum
  Tether
  USDC
USDC  Dogecoin
  Cardano
  Bitcoin Cash
  Polygon
  Litecoin
  LEO Token
  Hedera
  Cosmos Hub
  Stellar
  OKB
OKB  Maker
Maker  Algorand
  NEO
NEO  Gate
Gate  KuCoin
  Synthetix Network
  IOTA
IOTA  Tether Gold
  TrueUSD
  Enjin Coin
  Holo
Holo  Ravencoin
  0x Protocol
  Siacoin
  Basic Attention
  Zcash
Zcash  Decred
  Ontology
  Lisk
Lisk  Waves
Waves  DigiByte
  Numeraire
  Nano
Nano  Status
  Pax Dollar
  Steem
Steem  OMG Network
  BUSD
BUSD  Ren
Ren  Bitcoin Diamond
  Bytom
Bytom  Energi
  HUSD
HUSD  Augur
Augur