


XRP Might Target $0.50 If It Continues To Trade Above This Level
XRP has been trading on a bullish streak over the last few days. In the past week, the altcoin appreciated by close to 18%. On the daily chart, however, XRP slipped nearly 4%. Despite the fall on the daily chart, the altcoin was moving with bullish momentum.
The technical outlook of XRP has also sided with the bulls as buying strength has considerably recovered. Demand for the altcoin also noted a positive change. Accumulation also went up the chart as demand registered an increase.
Related Reading: Ethereum Price Rally To $2,000 On The Horizon, As Bears Show Weak Hands
Buyers’ confidence also rose as XRP managed to break past a few important resistance marks. XRP must remain above its immediate support level for the price to keep gaining strength.
With Bitcoin breaking past the $28,500 level, other altcoins will attempt to break past their immediate price ceilings. Currently, XRP is standing at a crucial resistance mark; a fall below this level might bring the bears back for a short period.
XRP Price Analysis: One-Day Chart

The altcoin was trading at $0.42 at the time of writing. XRP breached two very vital supports over the past week. The $0.39 level had acted as a stiff resistance level, which has now been flipped into a support line for the altcoin. Moving from the current price level will drag XRP to $0.40 and below $0.39.
The overhead price ceiling for the altcoin stood at $0.44; breaching that level will help the altcoin reach $0.46 and eventually $0.50.
The altcoin had reached $0.44 in recent trading sessions, but the bulls could not break through. For XRP to target $0.50, it must breach $0.44 and trade above that level for many trading sessions.
Technical Analysis
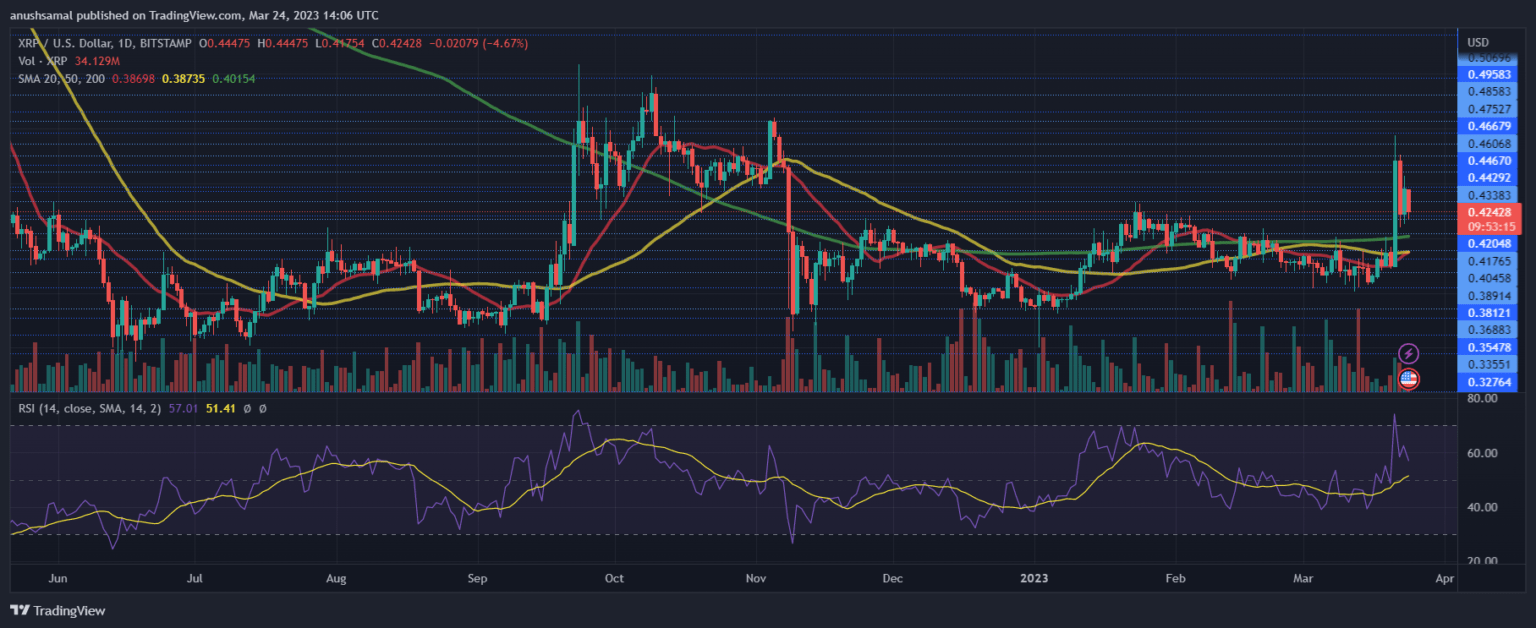
The altcoin was overbought over the past week; however, at press time, it was not. Buying strength remained positive, though.
The Relative Strength Index stood slightly below 60, indicating buyers still controlled the asset. Similarly, with an increase in demand, XRP moved above the 20-Simple Moving Average line, which also depicted that buyers were driving the price momentum in the market.
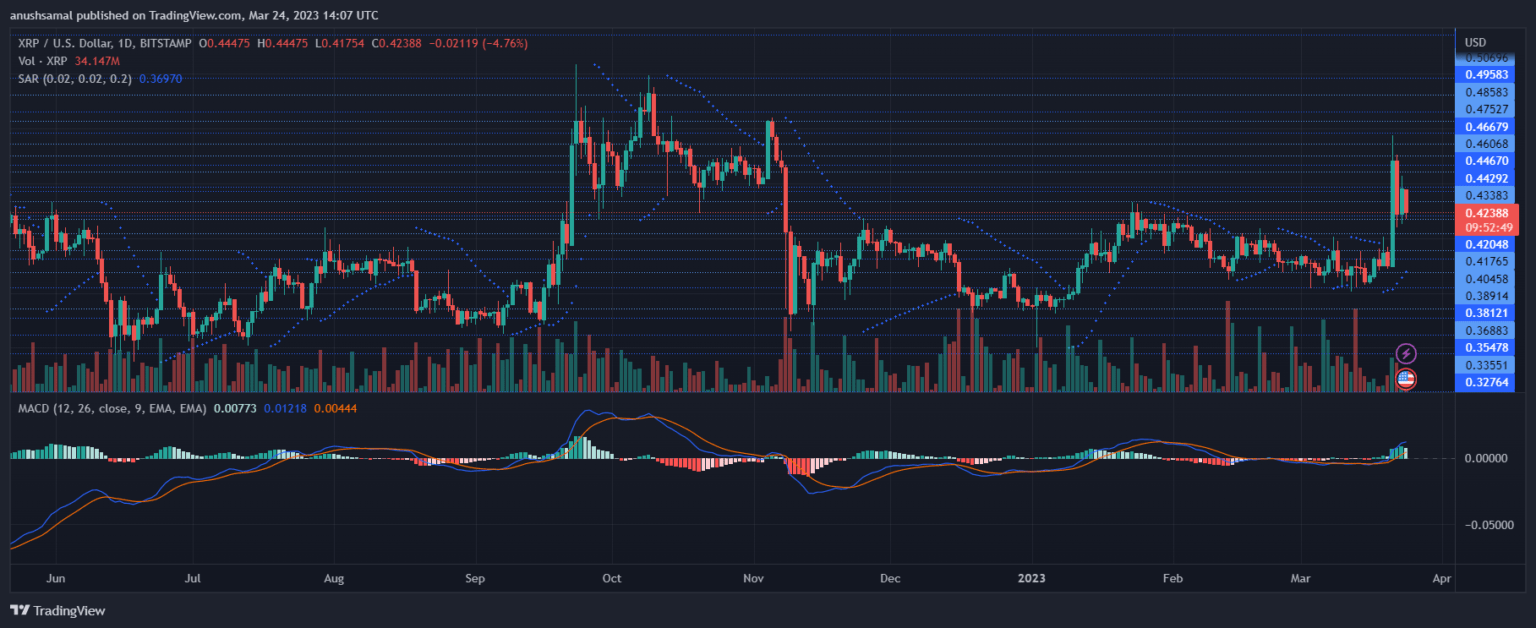
Other technical indicators also depicted that bulls were taking over the market. The Moving Average Convergence Divergence displays the price momentum and reversals in the trend. The indicator turned positive and displayed green histograms tied to buy signals for the altcoin.
Related Reading: Dogecoin (DOGE) Makes Slight 6% Climb This Week – Here’s Why
Parabolic SAR indicates price direction; the indicator was positive as dotted lines were formed underneath the candlesticks. These dotted lines suggested that the price was on an uptrend at press time.
Featured Image From UnSplash, Charts From TradingView.com


 Bitcoin
  Ethereum
  Tether
  USDC
USDC  Dogecoin
  Cardano
  Bitcoin Cash
  Polygon
  Litecoin
  LEO Token
  Hedera
  Cosmos Hub
  Stellar
  OKB
OKB  Maker
Maker  Algorand
  NEO
NEO  Gate
Gate  KuCoin
  Synthetix Network
  IOTA
IOTA  Tether Gold
  TrueUSD
  Enjin Coin
  Holo
Holo  Ravencoin
  Siacoin
  0x Protocol
  Basic Attention
  Zcash
Zcash  Decred
  Ontology
  Lisk
Lisk  Waves
Waves  DigiByte
  Nano
Nano  Status
  Numeraire
  Pax Dollar
  Steem
Steem  OMG Network
  BUSD
BUSD  Ren
Ren  Bitcoin Diamond
  Bytom
Bytom  HUSD
HUSD  Energi
  Augur
Augur