


Bull Vigor Builds; Technical Indicators Foresee SOL Price Gains

Over the previous 24 hours, the Solana (SOL) market has been bullish, with prices reaching a high of $25.22 before hitting resistance. As a consequence, bulls in SOL were able to value the price over yesterday’s close of $24.57 at the time of writing, with the price rising 7.81% to $24.81.
During the upturn, both market capitalization and 24-hour trading volume surged by 7.87% to $9,185,213,809 and 41.20% to $1,175,517,389, reflecting the confidence in SOL price gains.
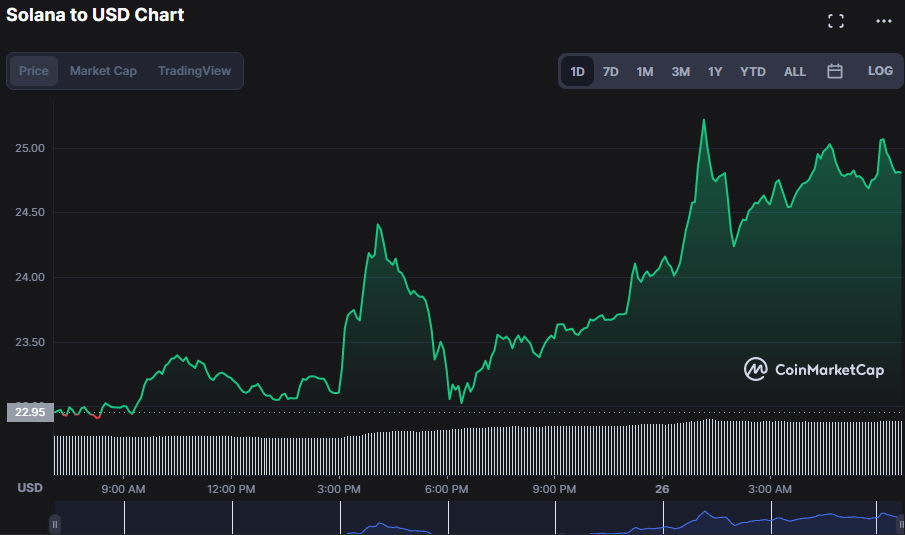
SOL/USD 24-hour price chart (source: CoinMarketCap)
Due to the increasing market volatility, the Bollinger bands are widening with the upper band at $25.46 and the lower band at $22.80, indicating a positive trend. This movement is clearly visible on the SOL 4-hour price chart, implying that as market confidence rises, significant price gain is expected to be sustained. This viewpoint is supported by SOL price moves towards the higher Bollinger band, reflecting the sustained bull dominance.
Due to the fact that the RSI is at 57.50, neither in the overbought nor oversold area, the bulls are likely to maintain their domination for the time being. Bullish hopes for even more of a rise are bolstered by the RSI’s upward movement, which indicates that purchasing pressure is rising.
With a value of 0.09, the MACD has crossed above the signal line, indicating that buyers have the upper hand. This uptick is further supported by the histogram’s position in the positive range, lending traders optimism for a longer bull run.
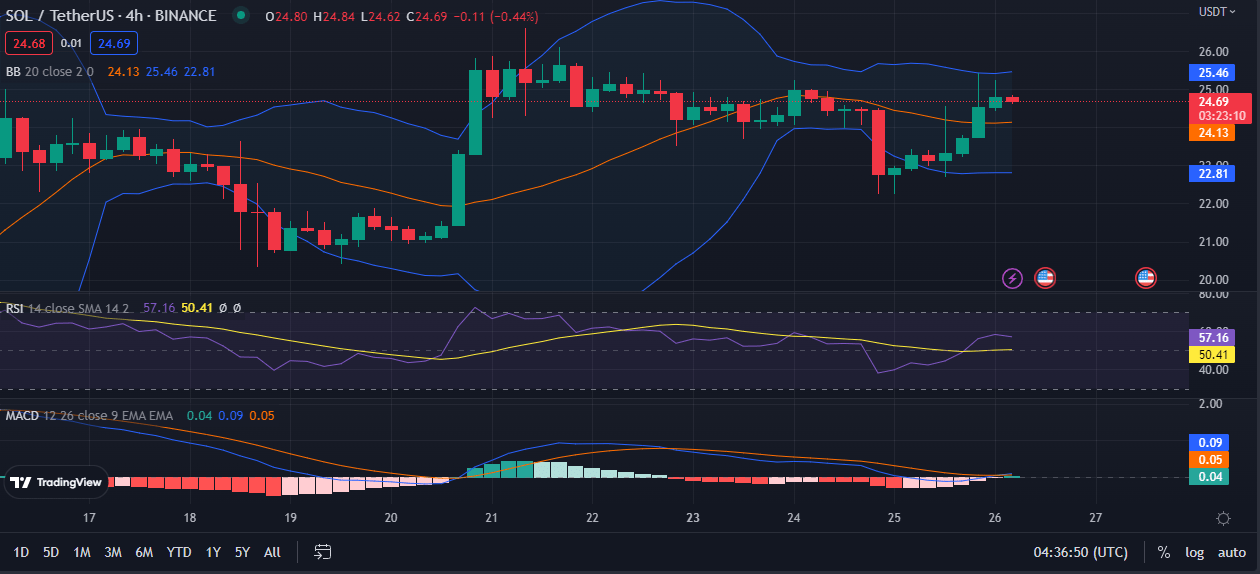
SOL/USDT 4-hour price chart (source: TradingView)
A golden cross (bullish crossover) is generated when the short-term MA crosses above the longer-term MA. This is reflected in the SOL price chart, where the 20-day MA is at $24.14 and the 100-day MA is at $21.60. This move foreshadows a further bull run, and it is supported by the green engulfing candlestick, which reflects enhanced bull power hence projecting further SOL price gain in the near term.
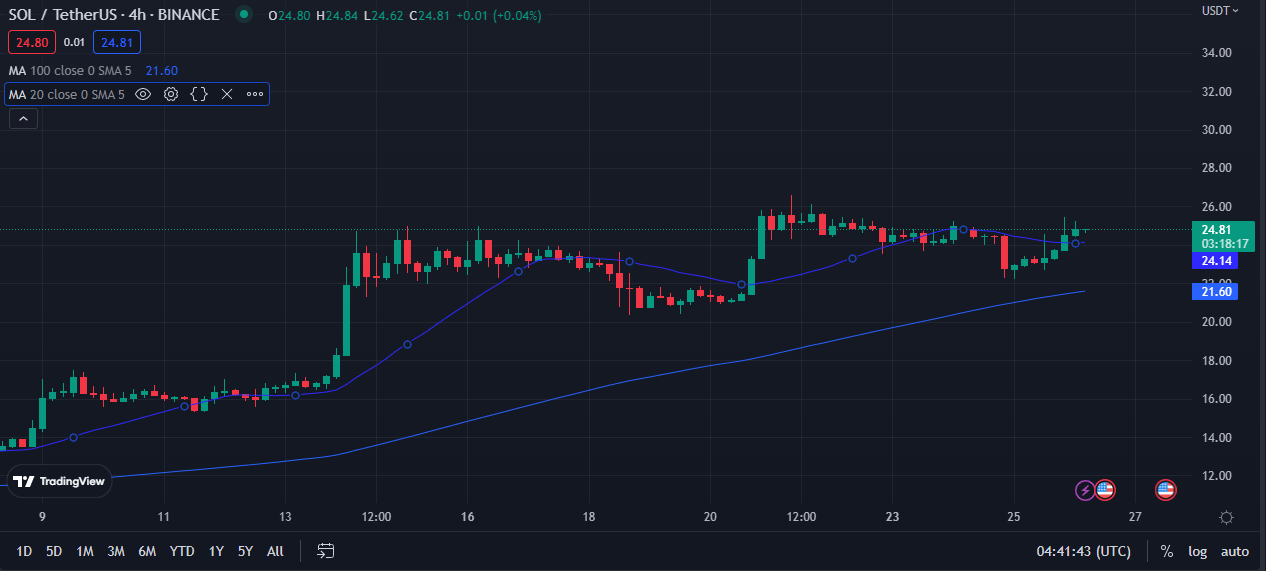
SOL/USDT 4-hour price chart (source: TradingView)
If SOL’s steady ascent is to continue, bulls need to keep pushing prices over their current resistance level.
Disclaimer: The views and opinions, as well as all the information shared in this price analysis, are published in good faith. Readers must do their own research and due diligence. Any action taken by the reader is strictly at their own risk, Coin Edition and its affiliates will not be held liable for any direct or indirect damage or loss.


 Bitcoin
  Ethereum
  Tether
  USDC
USDC  Dogecoin
  Cardano
  Bitcoin Cash
  Polygon
  Litecoin
  LEO Token
  Hedera
  Cosmos Hub
  Stellar
  OKB
OKB  Maker
Maker  Algorand
  NEO
NEO  Gate
Gate  KuCoin
  Synthetix Network
  IOTA
IOTA  Tether Gold
  TrueUSD
  Enjin Coin
  Holo
Holo  Ravencoin
  0x Protocol
  Siacoin
  Basic Attention
  Zcash
Zcash  Decred
  Ontology
  Lisk
Lisk  Waves
Waves  DigiByte
  Nano
Nano  Status
  Numeraire
  Pax Dollar
  Steem
Steem  OMG Network
  BUSD
BUSD  Ren
Ren  Bitcoin Diamond
  Bytom
Bytom  HUSD
HUSD  Energi
  Augur
Augur