


Bullish Pressure Captures WOO Market as Buying Spree Accelerates

- WOO market shows a positive trend at $0.2805 as the bulls drive the market higher.
- The WOO token has surged by over 10 percent in the past 24 hours.
- The resistance level for WOO is present at $0.2872, which may trigger a further rally.
The most recent WOO Network price analysis shows a strong upward trend with the bulls driving the market higher. The WOO token has surged by more than 10 percent in the past 24 hours and is currently trading at $0.2805. The buying pressure has been strong, as the token has breached several resistance levels.
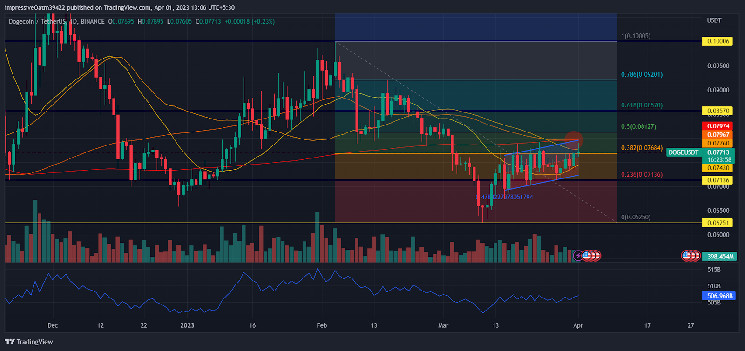
WOO/USD daily chart: CoinMarketCap
If Bulls persist and maintain their buying spree, the token will probably reach a new high at $0.30 in the near term. The immediate resistance for WOO is present at $0.2872, which could trigger a further rally breach. However, if the bulls fail to maintain their buying spree and the resistance holds, then the WOO may face a minor correction in its price, and move below the $0.2800 mark.
The market for WOO tokens opened today’s trading session at $0.2543, which was slightly above the 24-hour low of $0.2526. The bulls quickly started their buying spree, and the token surged to a high of $0.2902 in just a few hours before correcting itself to the current levels at $0.2805. The market capitalization of the token is currently at $467,972,299, indicating that more investors are taking interest in the token.
Technical Indicators on the Daily Chart
The daily technical indicators show strong bullish momentum in the WOO market. The 20-EMA is above the 50-EMA, which shows a strong uptrend. Similarly, the 50-day moving average is also above the 100-day moving average, indicating a strong bullish trend. The RSI indicator is in the neutral zone at the 55 level and if bullish pressure continues, then the RSI enters the over-bought zone, which could lead to a further surge in the WOO token’s price.
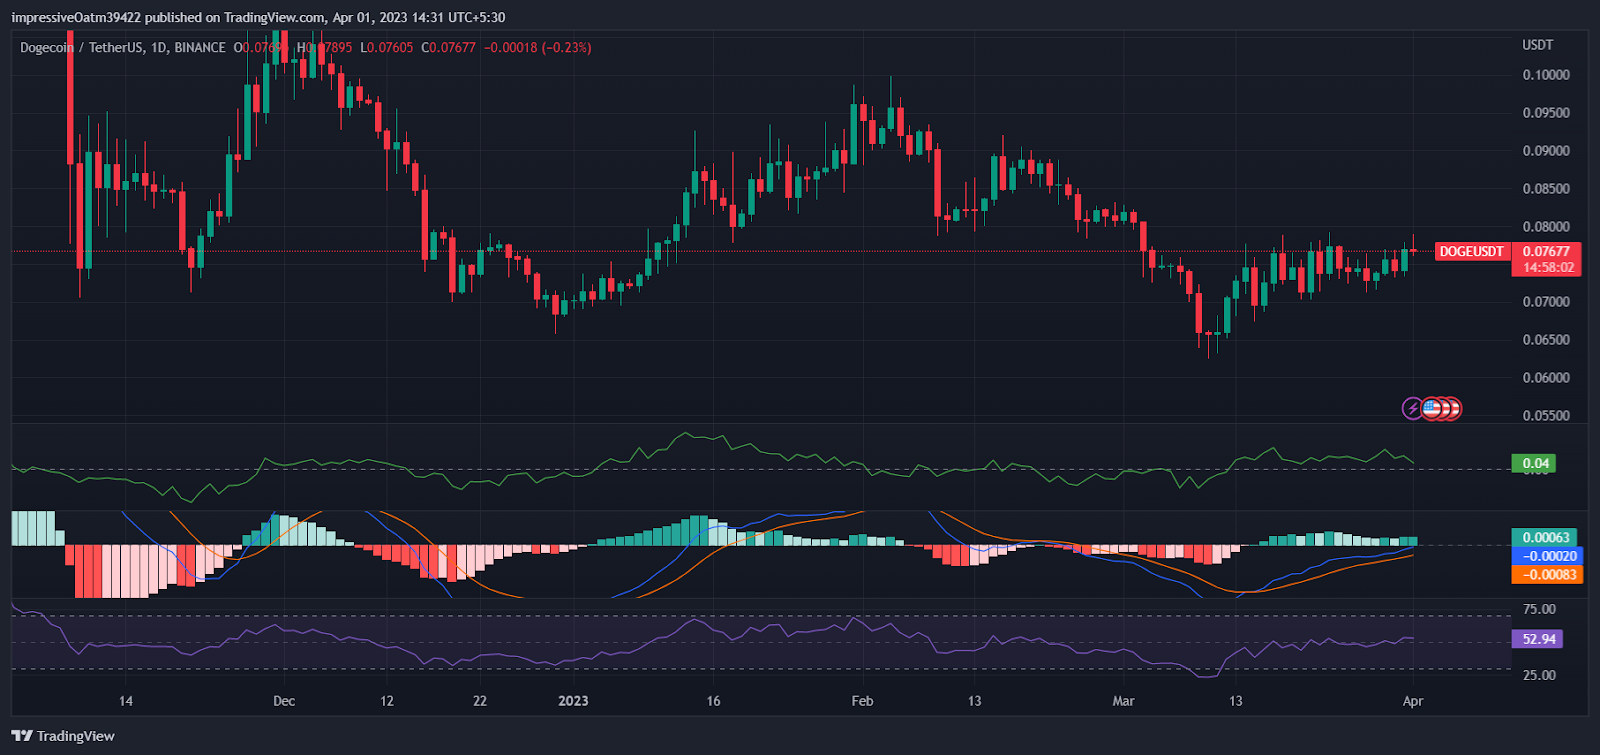
WOO/USD 1-day chart: TradingView
The Bollinger bands in the daily chart are widening, which indicates high volatility in the market. The upper Bollinger band is present at $0.34 which could be the next resistance level to watch out for if the bulls maintain their buying momentum, while the lower Bollinger band is present at $0.0.177, which could be the next support level if the price falls.
To sum up, the WOO Network price analysis shows a strong bullish trend in the market. The buying pressure has been strong, and if it persists, then WOO is likely to reach new highs soon. The technical indicators are also showing a strong bullish trend as more buying pressure is expected in the coming days.


 Bitcoin
  Ethereum
  Tether
  USDC
USDC  Dogecoin
  Cardano
  Bitcoin Cash
  Polygon
  Litecoin
  LEO Token
  Hedera
  Cosmos Hub
  Stellar
  OKB
OKB  Maker
Maker  Algorand
  NEO
NEO  Gate
Gate  KuCoin
  Synthetix Network
  IOTA
IOTA  Tether Gold
  TrueUSD
  Enjin Coin
  Holo
Holo  Ravencoin
  0x Protocol
  Siacoin
  Basic Attention
  Zcash
Zcash  Decred
  Ontology
  Lisk
Lisk  Waves
Waves  DigiByte
  Nano
Nano  Numeraire
  Status
  Pax Dollar
  Steem
Steem  OMG Network
  BUSD
BUSD  Ren
Ren  Bytom
Bytom  Bitcoin Diamond
  HUSD
HUSD  Energi
  Augur
Augur