

Can Polygon (MATIC) Price Recover After 17% Weekly Drop?

The Polygon (MATIC) price has fallen since February and has reached the support line of a long-term pattern, which has contained the price movement since June 2022.
Since this is a long-term pattern, the price mustn’t break down for the long-term upward movement to remain intact. However, with the bearish indicator readings in place, will MATIC be able to bounce?
Polygon Price Falters Toward Support
The technical analysis from the long-term weekly time frame gives a bearish outlook for MATIC, the native token of the Polygon network. There are several reasons for this. Firstly, the price is trading inside an ascending parallel channel.
This is a type of pattern in which the price bounces between two parallel resistance and support lines. It is considered a bearish pattern, meaning that an eventual breakdown from it would be the most likely outlook. The fact that the price trades in the lower portion of the channel.
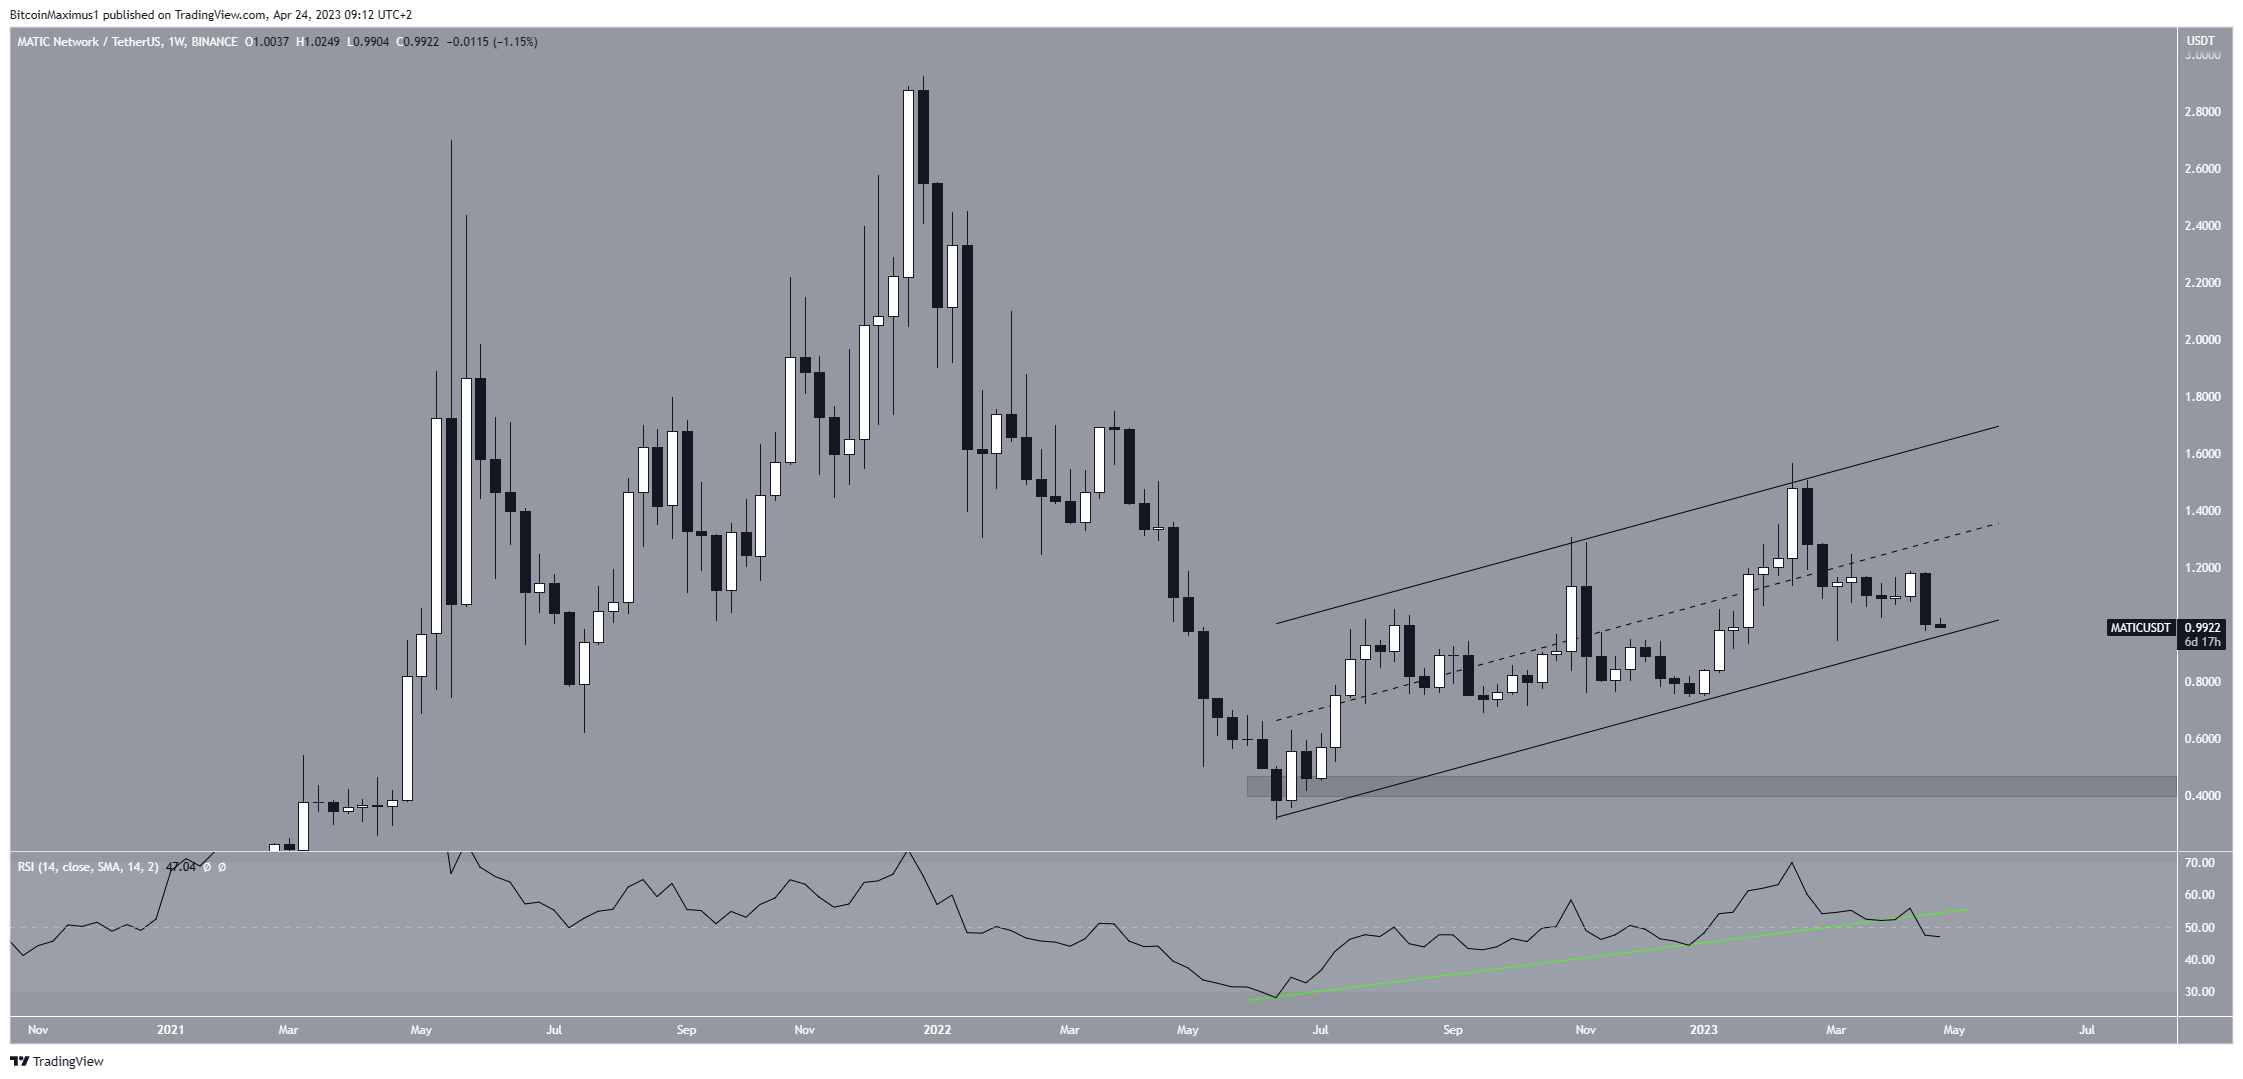
MATIC/USDT Weekly Chart. Source: TradingView
Secondly, the weekly Relative Strength index (RSI) gives a bearish reading. By using the RSI as a momentum indicator, traders can determine whether a market is overbought or oversold and decide whether to accumulate or sell an asset. If the RSI reading is above 50 and the trend is upward, bulls have an advantage, but if the reading is below 50, the opposite is true. In the case of MATIC, the RSI broke down from its trendline (green line) and decreased below 50. Both these bearish signs support the continuation of the decrease.
If the MATIC price breaks down from the channel, the next closest support area would be $0.43. On the other hand, if it bounces at the channel’s support line, an increase toward the midline at $1.40 will be the most likely scenario.
Polygon (MATIC) Price Prediction: Is a Breakdown Imminent?
The daily time frame outlook aligns with the weekly one. It shows that the MATIC price broke down from a shorter-term ascending support line, which has been in place since the beginning of the year. When a line measures the slope of increase for a certain period of time, a breakdown from it means that the preceding trend is now over. In the case of MATIC, that trend was bullish.
Additionally, the price fell below the $1.04 horizontal support area, further legitimizing the breakdown. The area had intermittently acted as both resistance and support. As a result, the breakdown from it is a strong bearish sign.
Finally, the daily RSI is below 50 (red icon) and decreasing. Therefore, the signs from both the weekly and daily time frames support the continuing decrease toward $0.43.
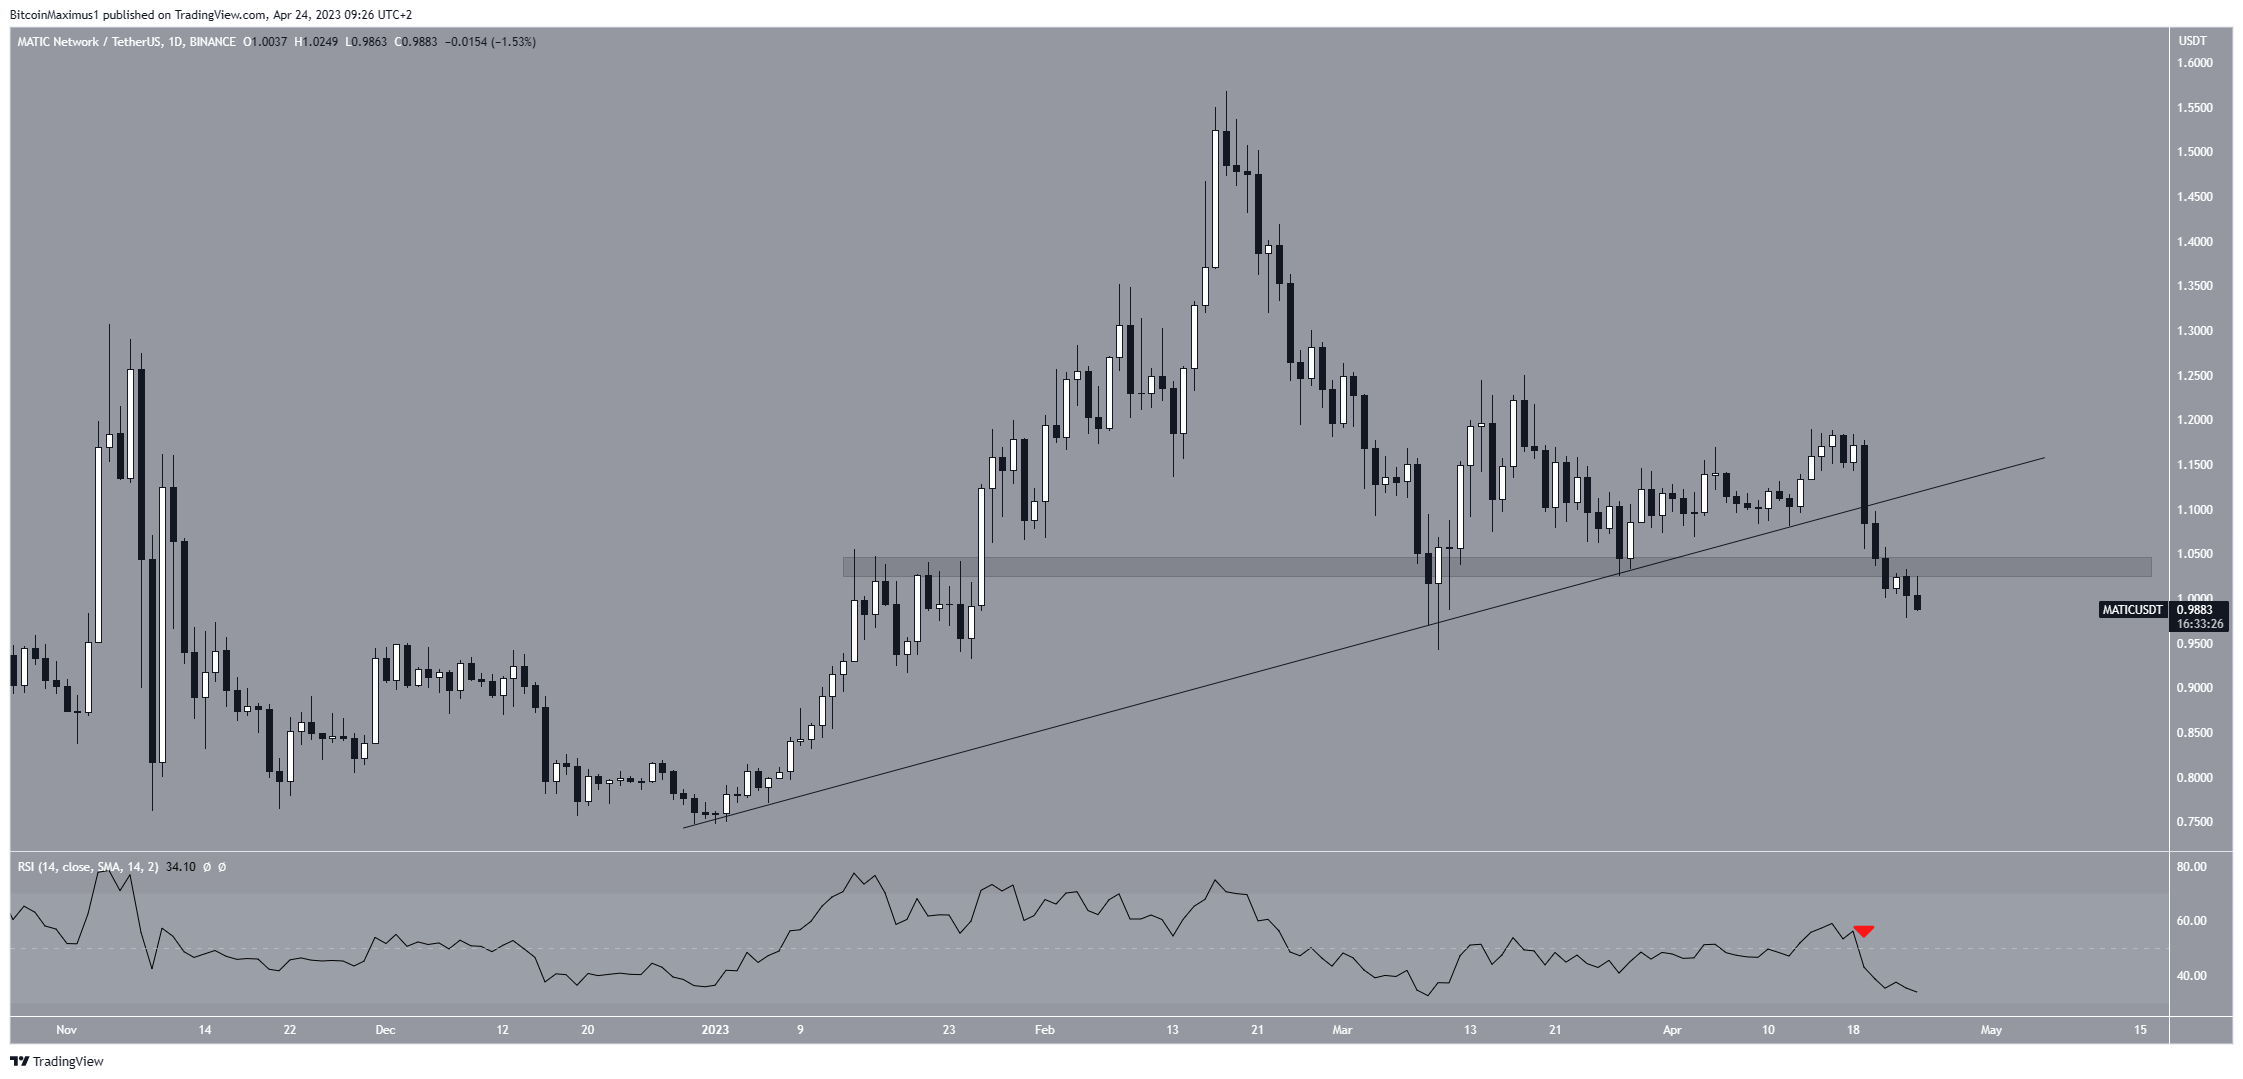
MATIC/USDT Daily Chart. Source: TradingView
Despite the bearish MATIC price prediction, reclaiming the $1.04 area will mean that at least a short-term increase is on the cards. In that case, the MATIC token could move to $1.20.
For BeInCrypto’s latest crypto market analysis, click here.


 Bitcoin
  Ethereum
  Tether
  USDC
USDC  Dogecoin
  Cardano
  Stellar
  Bitcoin Cash
  Hedera
  Litecoin
  LEO Token
  OKB
OKB  Algorand
  VeChain
  Cosmos Hub
  Gate
Gate  KuCoin
  Tether Gold
  IOTA
IOTA  Zcash
Zcash  TrueUSD
  NEO
NEO  Polygon
  Decred
  Basic Attention
  Synthetix Network
  Ravencoin
  0x Protocol
  Holo
Holo  Siacoin
  DigiByte
  Enjin Coin
  Nano
Nano  Ontology
  Waves
Waves  Status
  Numeraire
  Steem
Steem  Pax Dollar
  BUSD
BUSD  OMG Network
  Ren
Ren  Augur
Augur  Bitcoin Diamond