


Cardano (ADA) Price Hits Roadblock at Resistance: Where to From Here?
The Cardano (ADA) price shows bearish signs in numerous timeframes. These could lead to the acceleration of the ongoing downward movement.
Besides failing to break out from a long-term resistance, the ADA price broke down from a short-term pattern. This solidifies the bearish price trend.
Cardano Price Bounces but Fails to Reclaim Resistance
ADA is the native token of the Cardano blockchain, created by Charles Hoskinson. The ADA token price steeply declined over the last two weeks, as evidenced by the long-term weekly time frame readings.
This created a bearish engulfing candlestick, which is a type of bearish candlestick that erases the entire previous period’s increase. The confirmation of this bearish pattern comes with a close below the opening of the previous period.
Furthermore, this candlestick caused the ADA price to drop below the significant horizontal area of $0.425. This is a critical development because it shows that the previous breakout was not valid.
As a result, instead of acting as support, the $0.425 area will now serve as resistance again. This was especially evident last week. Despite the bounce, the ADA price failed to reclaim the $0.425 area, rather it validated it as resistance (red icon).
So, despite previously breaking out from a descending resistance line that was in place since the all-time high, the recent price action indicates a bearish trend. If this decline continues, the next nearest support area will be at an average price of $0.315.
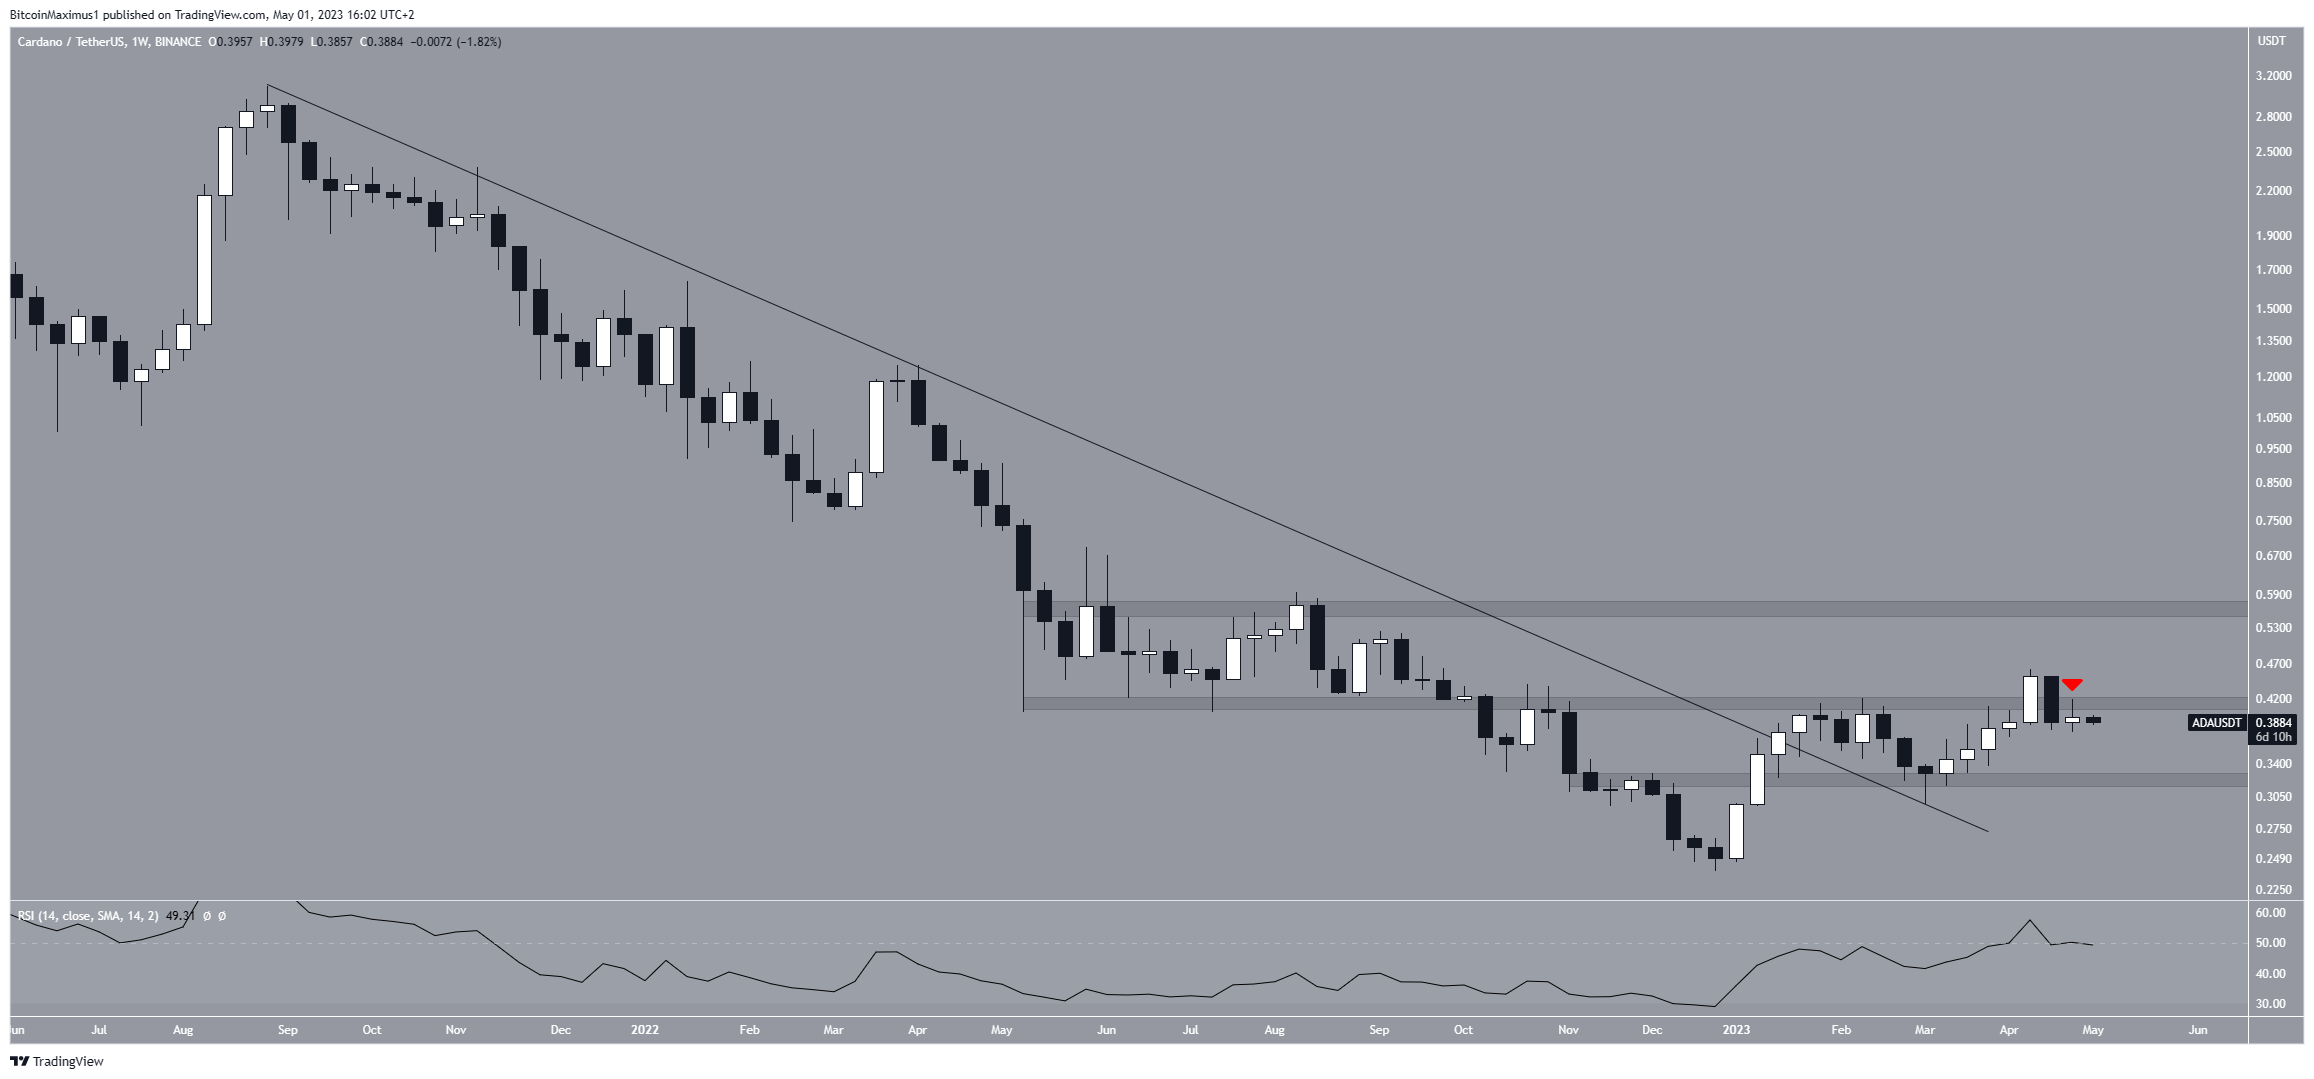
ADA/USDT Weekly Chart. Source: TradingView
The weekly Relative Strength Index (RSI) does not provide any hints as to the trend’s direction. The RSI is a momentum indicator used by traders to evaluate whether a market is overbought or oversold, and to determine whether to accumulate or sell an asset.
Readings above 50 and an upward trend suggest that bulls still have an advantage, while readings below 50 indicate the opposite. The current reading of 50 is a sign of a neutral trend.
ADA Price Prediction: How Long Will the Drop Continue?
The daily time frame technical analysis from the daily time frame also gives a bearish Cardano price prediction. The reasons for this can be attributed to both price action and indicator readings.
Firstly, on April 20, the ADA token price broke down from an ascending parallel channel that it had been trading in since March 10. This type of channel is characterized by the price moving between two parallel resistance and support lines and is generally considered a bearish pattern.
After breaking down, ADA validated it as resistance on April 27 (red icon) before resuming its descent.
Secondly, the daily Relative Strength Index (RSI) also contributed to this trend as it broke down from an ascending support line (represented by the green line) and is currently below 50.
Traders commonly use the RSI as a momentum indicator to identify overbought or oversold conditions and decide whether to sell or accumulate an asset.
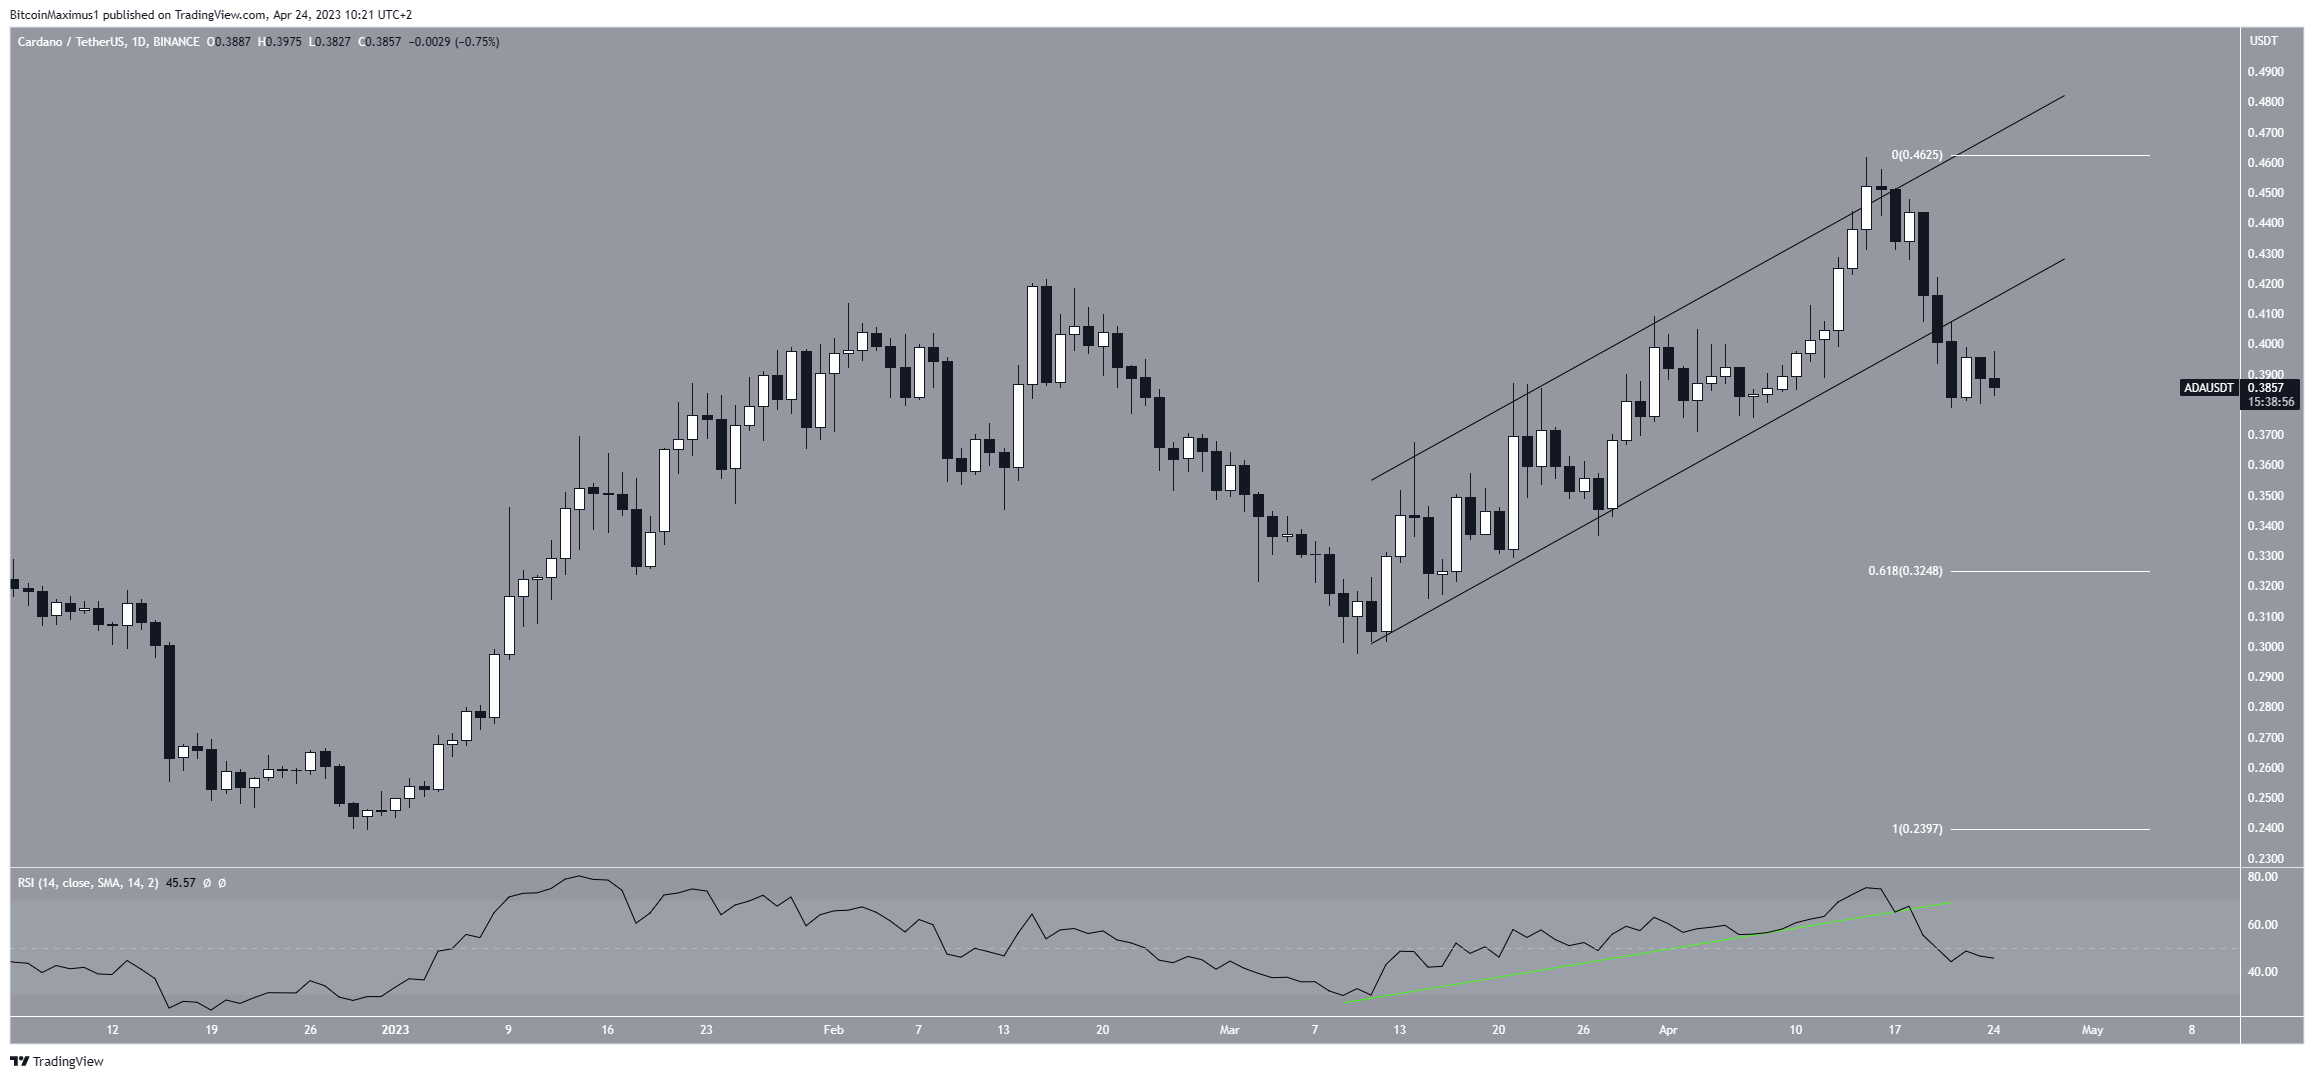
ADA/USDT Daily Chart. Source: TradingView
In order for this bearish Cardano price forecast to be invalidated, the ADA price will have to reclaim the channel’s support line.
In that case, an upward movement to $0.48 could follow.


 Bitcoin
  Ethereum
  Tether
  USDC
USDC  Dogecoin
  Cardano
  Bitcoin Cash
  Polygon
  Litecoin
  LEO Token
  Hedera
  Cosmos Hub
  Stellar
  OKB
OKB  Maker
Maker  Algorand
  NEO
NEO  Gate
Gate  KuCoin
  Synthetix Network
  IOTA
IOTA  Tether Gold
  TrueUSD
  Enjin Coin
  Holo
Holo  Ravencoin
  0x Protocol
  Siacoin
  Basic Attention
  Zcash
Zcash  Decred
  Ontology
  Lisk
Lisk  Waves
Waves  DigiByte
  Numeraire
  Status
  Nano
Nano  Pax Dollar
  Steem
Steem  OMG Network
  BUSD
BUSD  Ren
Ren  Bitcoin Diamond
  Bytom
Bytom  HUSD
HUSD  Energi
  Augur
Augur