


Cardano value depreciates to $0.2662 after a bearish extension
The current Cardano price analysis suggests the price has been suppressed again from the bearish side, as a rejection from the upside has been reported for today. The price covers a range below $0.2866 due to the return of bearish pressure after a single day of bullish activity. The coin value recovered slightly during the previous trading session, but today the bears have interfered again, and the price has reached $0.2662. The current price level is also a support level set earlier by the bulls, which is currently being tested. Next, support for ADA is present below $0.2603.
The one-day chart for Cardano price analysis shows a bearish trend as the red candlestick has returned to the price chart. The past few days have proved crucial for the cryptocurrency, except for one day as a steep downward trend followed. There has been a recurring fall, as the price has stepped down into the lower price envelope at $0.2662. The current price value is lower than the moving average (MA) value, which is settled at $0.298.
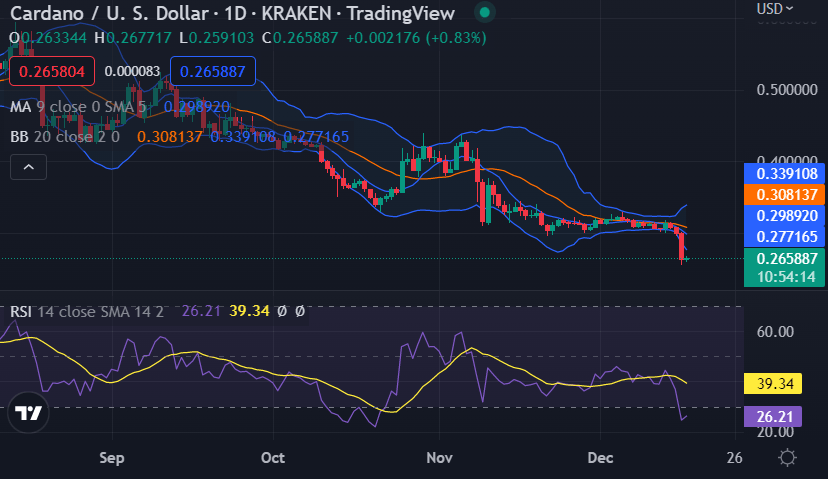
ADA/USD 1-day price chart. Source: TradingView
The SMA 50 curve is traveling high again as the bears are regaining their strength. The Bollinger Bands Indicator in the 1-day price chart points out the following values; the upper value at $0.3391, while the lower one at $0.277. The Relative Strength Index (RSI) score has decreased up to index 39.34 as well because of the deficit in price due to more selling.
According to the four hours Cardano price analysis, the price has been traveling low. The recent downturn in price movement has resulted in its decline as it has been lowered to $0.2662. Chances of recovery seem minimized as the bearish slide has been proceeding uninterruptedly, severely damaging the coin value. The price has gone below the moving average value as well, which has been standing at a $0.2752 position below the SMA 50 curve.
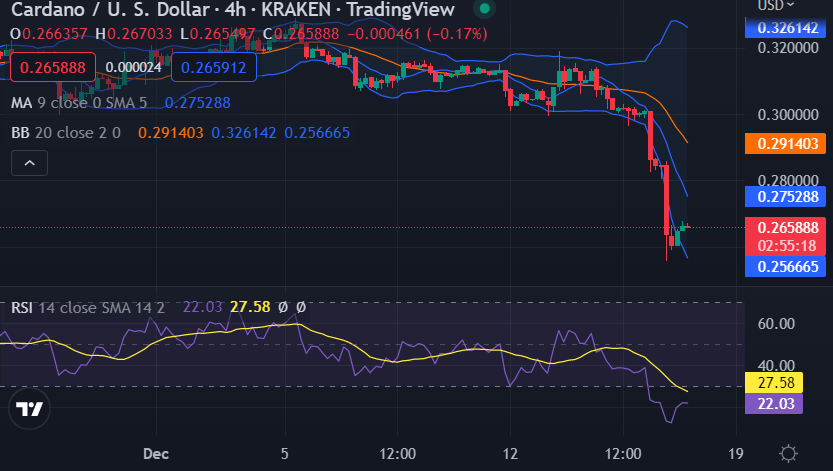
ADA/USD 4-hour price chart. Source: TradingView
As the volatility is on the increasing trend, the upper Bollinger band is now touching the $0.3261 mark, whereas the lower Bollinger band is on the $ 0.2566 mark. The RSI curve has descended to the 27.58 mark, confirming a sharp drop in price.
To sum up, the Cardano price analysis concludes the bears are playing their game once again after a continuous drop in price occurred during the past few hours. The cryptocurrency price has returned to the $0.2662 level, thus confirming the decrease in price. We can expect a downward price movement in the upcoming hours, as the four hours price analysis is also giving bearish hints.


 Bitcoin
  Ethereum
  Tether
  USDC
USDC  Dogecoin
  Cardano
  Bitcoin Cash
  Polygon
  Litecoin
  LEO Token
  Hedera
  Stellar
  Cosmos Hub
  OKB
OKB  Maker
Maker  Algorand
  NEO
NEO  Gate
Gate  KuCoin
  Synthetix Network
  IOTA
IOTA  Tether Gold
  TrueUSD
  Holo
Holo  Enjin Coin
  0x Protocol
  Ravencoin
  Siacoin
  Basic Attention
  Ontology
  Zcash
Zcash  Decred
  Waves
Waves  Lisk
Lisk  DigiByte
  Nano
Nano  Status
  Numeraire
  Pax Dollar
  Steem
Steem  OMG Network
  BUSD
BUSD  Ren
Ren  Bytom
Bytom  Bitcoin Diamond
  HUSD
HUSD  Energi
  Augur
Augur