


EOS Technical Analysis: Will The EOS Rebound From Its One-Year-Low?

The EOS technical analysis displays consolidation despite a declining trend, after prices pulled back from $0.84, eyeing another breakout as RSI signal enthusiasm among buyers. EOS has been going through a strong downtrend over the last two weeks due to the financial crises of crypto exchange FTX, as the token has plunged more than 23.2% in the last 14 days, hitting its 52-week low of 0.$82 on November 10. Although the prices attempted to rebound EOS could not break above $0.91 and pull back to $0.85 which accounted for a drop of 4.35% over the last 24 hours. EOS’s decline is supported by the market cap which also dropped by 4.07% during the last 24 hours due to a lack of demand among traders. While 24 hours trading volume of EOS jumped 53.17% the token showed signs of reversal as RSI displayed a balance between demand and supply.
Key Points
- The EOS price actions show consolidation despite bearish momentum
- Pull back at $0.84 signal towards potential bullish reversal
- With a 53% jump, the intraday trading volume in EOS stands at $142.96 million
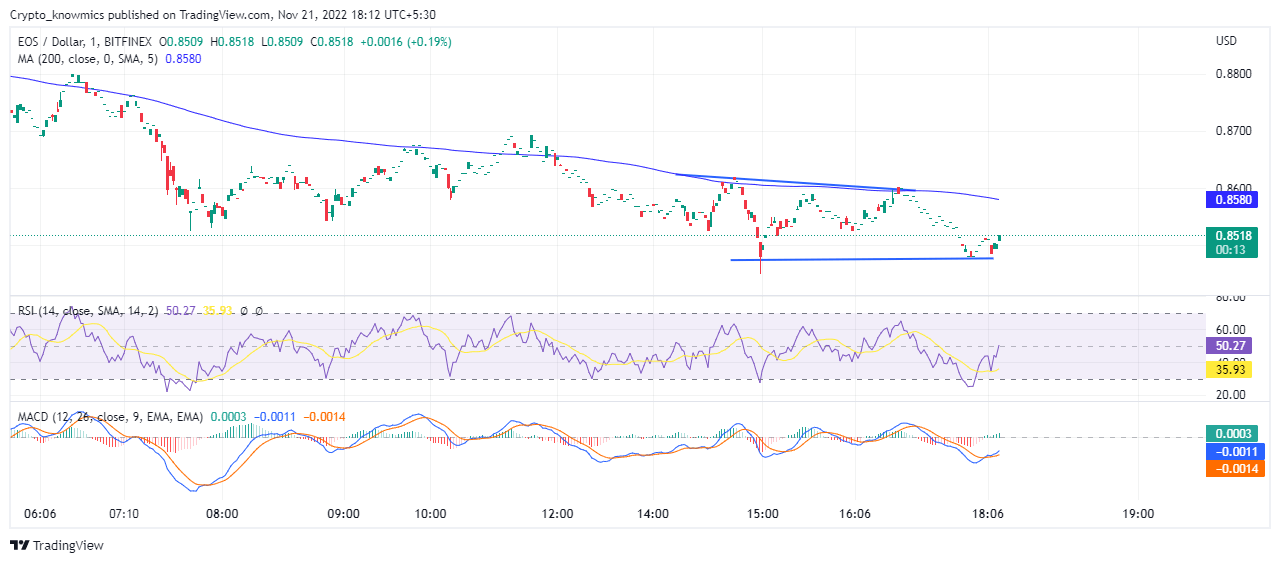
Source: Tradingview
EOS Technical Analysis
After witnessing a sharp drop over the last few days, today’s trading chart represents that EOS prices have been consolidating between the range of $0.86 and $0.84. Although EOS price actions maintain a downtrend, the 200-day SMA teasing the resistance trendline signals the possibility of a bullish breakout in the near future. At a current price of $0.85, the EOS prices pulled back from $0.84 twice, indicating the increasing chances of a bullish reversal. If prices witness a bullish breakout at this stage, the EOS may break above the psychologically important mark of $1, providing multiple buying opportunities for the sideline traders. Conversely, if the token falls below $0.80 it may trigger another selling spree that would take the price below the $0.50 mark.
Technical Indicators
RSI narrowly escaped the bearish divergence after making a bullish divergence above the oversold boundary, approaching the midway line, with a 14-day moving average at the 35 mark showing slight relief from selling pressure. On the other hand, after making a bullish crossover, fast and slow lines showed increasing gaps as MACD is set for another upswing on a bullish histogram. The technical indicators show that EOS tries to gain reversal momentum after consolidating with the RSI striking a balance between demand and supply with another upswing on the MACD chart.


 Bitcoin
  Ethereum
  Tether
  USDC
USDC  Dogecoin
  Cardano
  Bitcoin Cash
  Polygon
  Litecoin
  LEO Token
  Hedera
  Stellar
  Cosmos Hub
  OKB
OKB  Maker
Maker  Algorand
  NEO
NEO  Gate
Gate  Synthetix Network
  KuCoin
  IOTA
IOTA  Tether Gold
  TrueUSD
  Holo
Holo  Enjin Coin
  Ravencoin
  0x Protocol
  Siacoin
  Basic Attention
  Ontology
  Zcash
Zcash  Decred
  Lisk
Lisk  Waves
Waves  DigiByte
  Status
  Numeraire
  Nano
Nano  Pax Dollar
  Steem
Steem  OMG Network
  BUSD
BUSD  Ren
Ren  Bytom
Bytom  Bitcoin Diamond
  HUSD
HUSD  Energi
  Augur
Augur