


Five altcoins above 200-day MA that could explode soon, ranked best to worst

Share:
- Altcoins trading above the 200-day SMA are ahead of the curve and likely to outperform other cryptocurrencies.
- These five altcoins include TRX, ENJ, ONT, ATOM and VET.
- However, not all altcoins above the 200-day SMA are created equal.
TRON (TRX), Enjin (ENJ), Solar (SXP), Ontology (ONT) and Cosmos(ATOM) are the five altcoins that show promise of an explosive performance in the upcoming days. Investors are also advised to keep a close eye on Bitcoin price, which has recently suffered a minor setback, pausing its 2023 rally.
Importance of 200-day SMA
The 200-day Simple Moving Average (SMA) is generally considered an important technical indicator to determine if the asset is in an uptrend or downtrend. A crossover of this indicator with the 50-day SMA will confirm the ongoing trend. However, for this discussion, let us look at the altcoins above the longer-term SMA and see where the underlying asset can go next.
For example, SKALE (SKL) price saw an 82% upswing after it flipped the resistance posed by the 200-day SMA into a support floor on February 6. After this move, SKL also overcame the hurdle at $0.3664 and tagged the $0.0601 blockade and set up a local high at $0.06979, clocking in an 82% gain in four days.
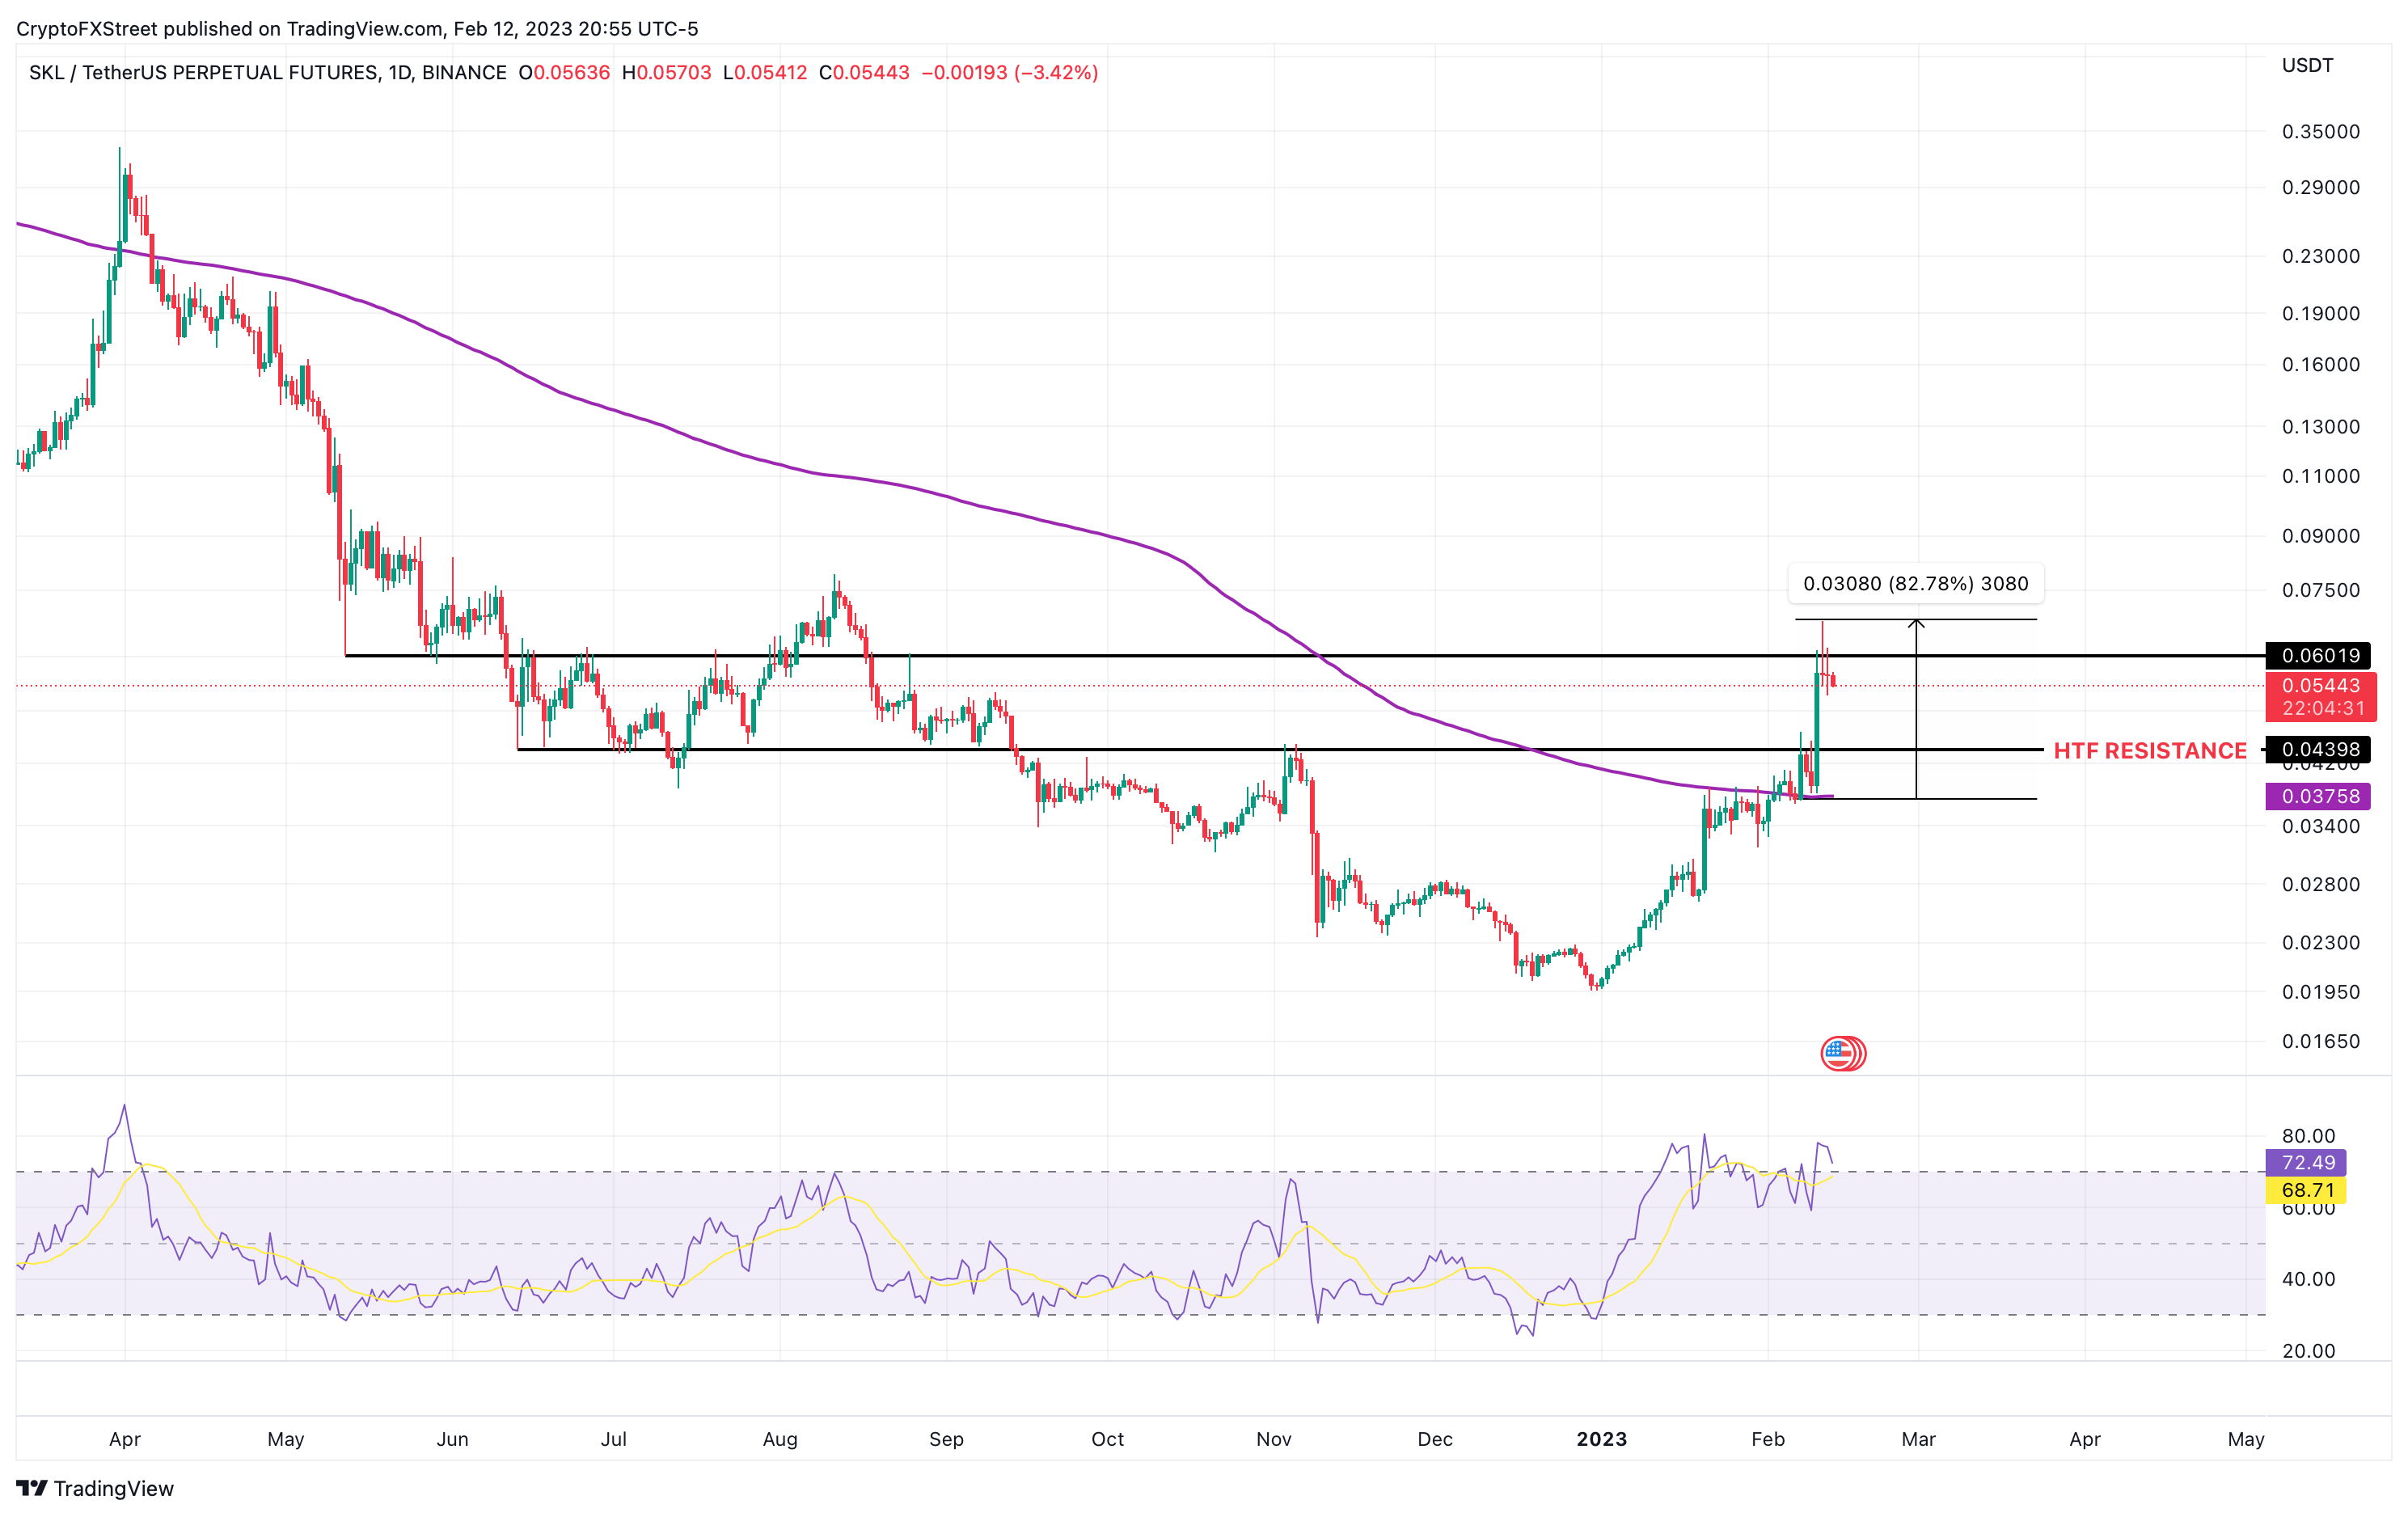
SKL/USDT 1-day chart
Five altcoins ready to explode: Best to worst
- TRON (TRX)
- Enjin (ENJ)
- Ontology (ONT)
- Solar (SXP)
- Cosmos (ATOM)
TRON price action is by far the best among the bunch for a few reasons, increasing its chances of an explosive move. The major reason behind this bullishness is its move above the 200-day SMA on January 26. Since then, the altcoin has spent nearly three weeks trading above it.
The second reason is that TRX has produced a hidden bullish divergence. This technical formation is when the asset’s price produces higher lows while the momentum indicator, in this case, the Relative Strength Index (RSI), produces lower lows.
This non-conformity is often spotted in an uptrend when the underlying asset produces a pullback. The setup signals a continuation of the uptrend.
In TRON price’s case, the altcoin is also facing an intermediate hurdle at $0.0645. If the bulls flip this hurdle on its head, it will confirm the uptrend’s start. TRX could rally 12% to sweep equal highs at $0.0720. Beyond this level, market makers could also target the liquidity resting above $0.0932, which would require a 44% upswing from $0.0645.
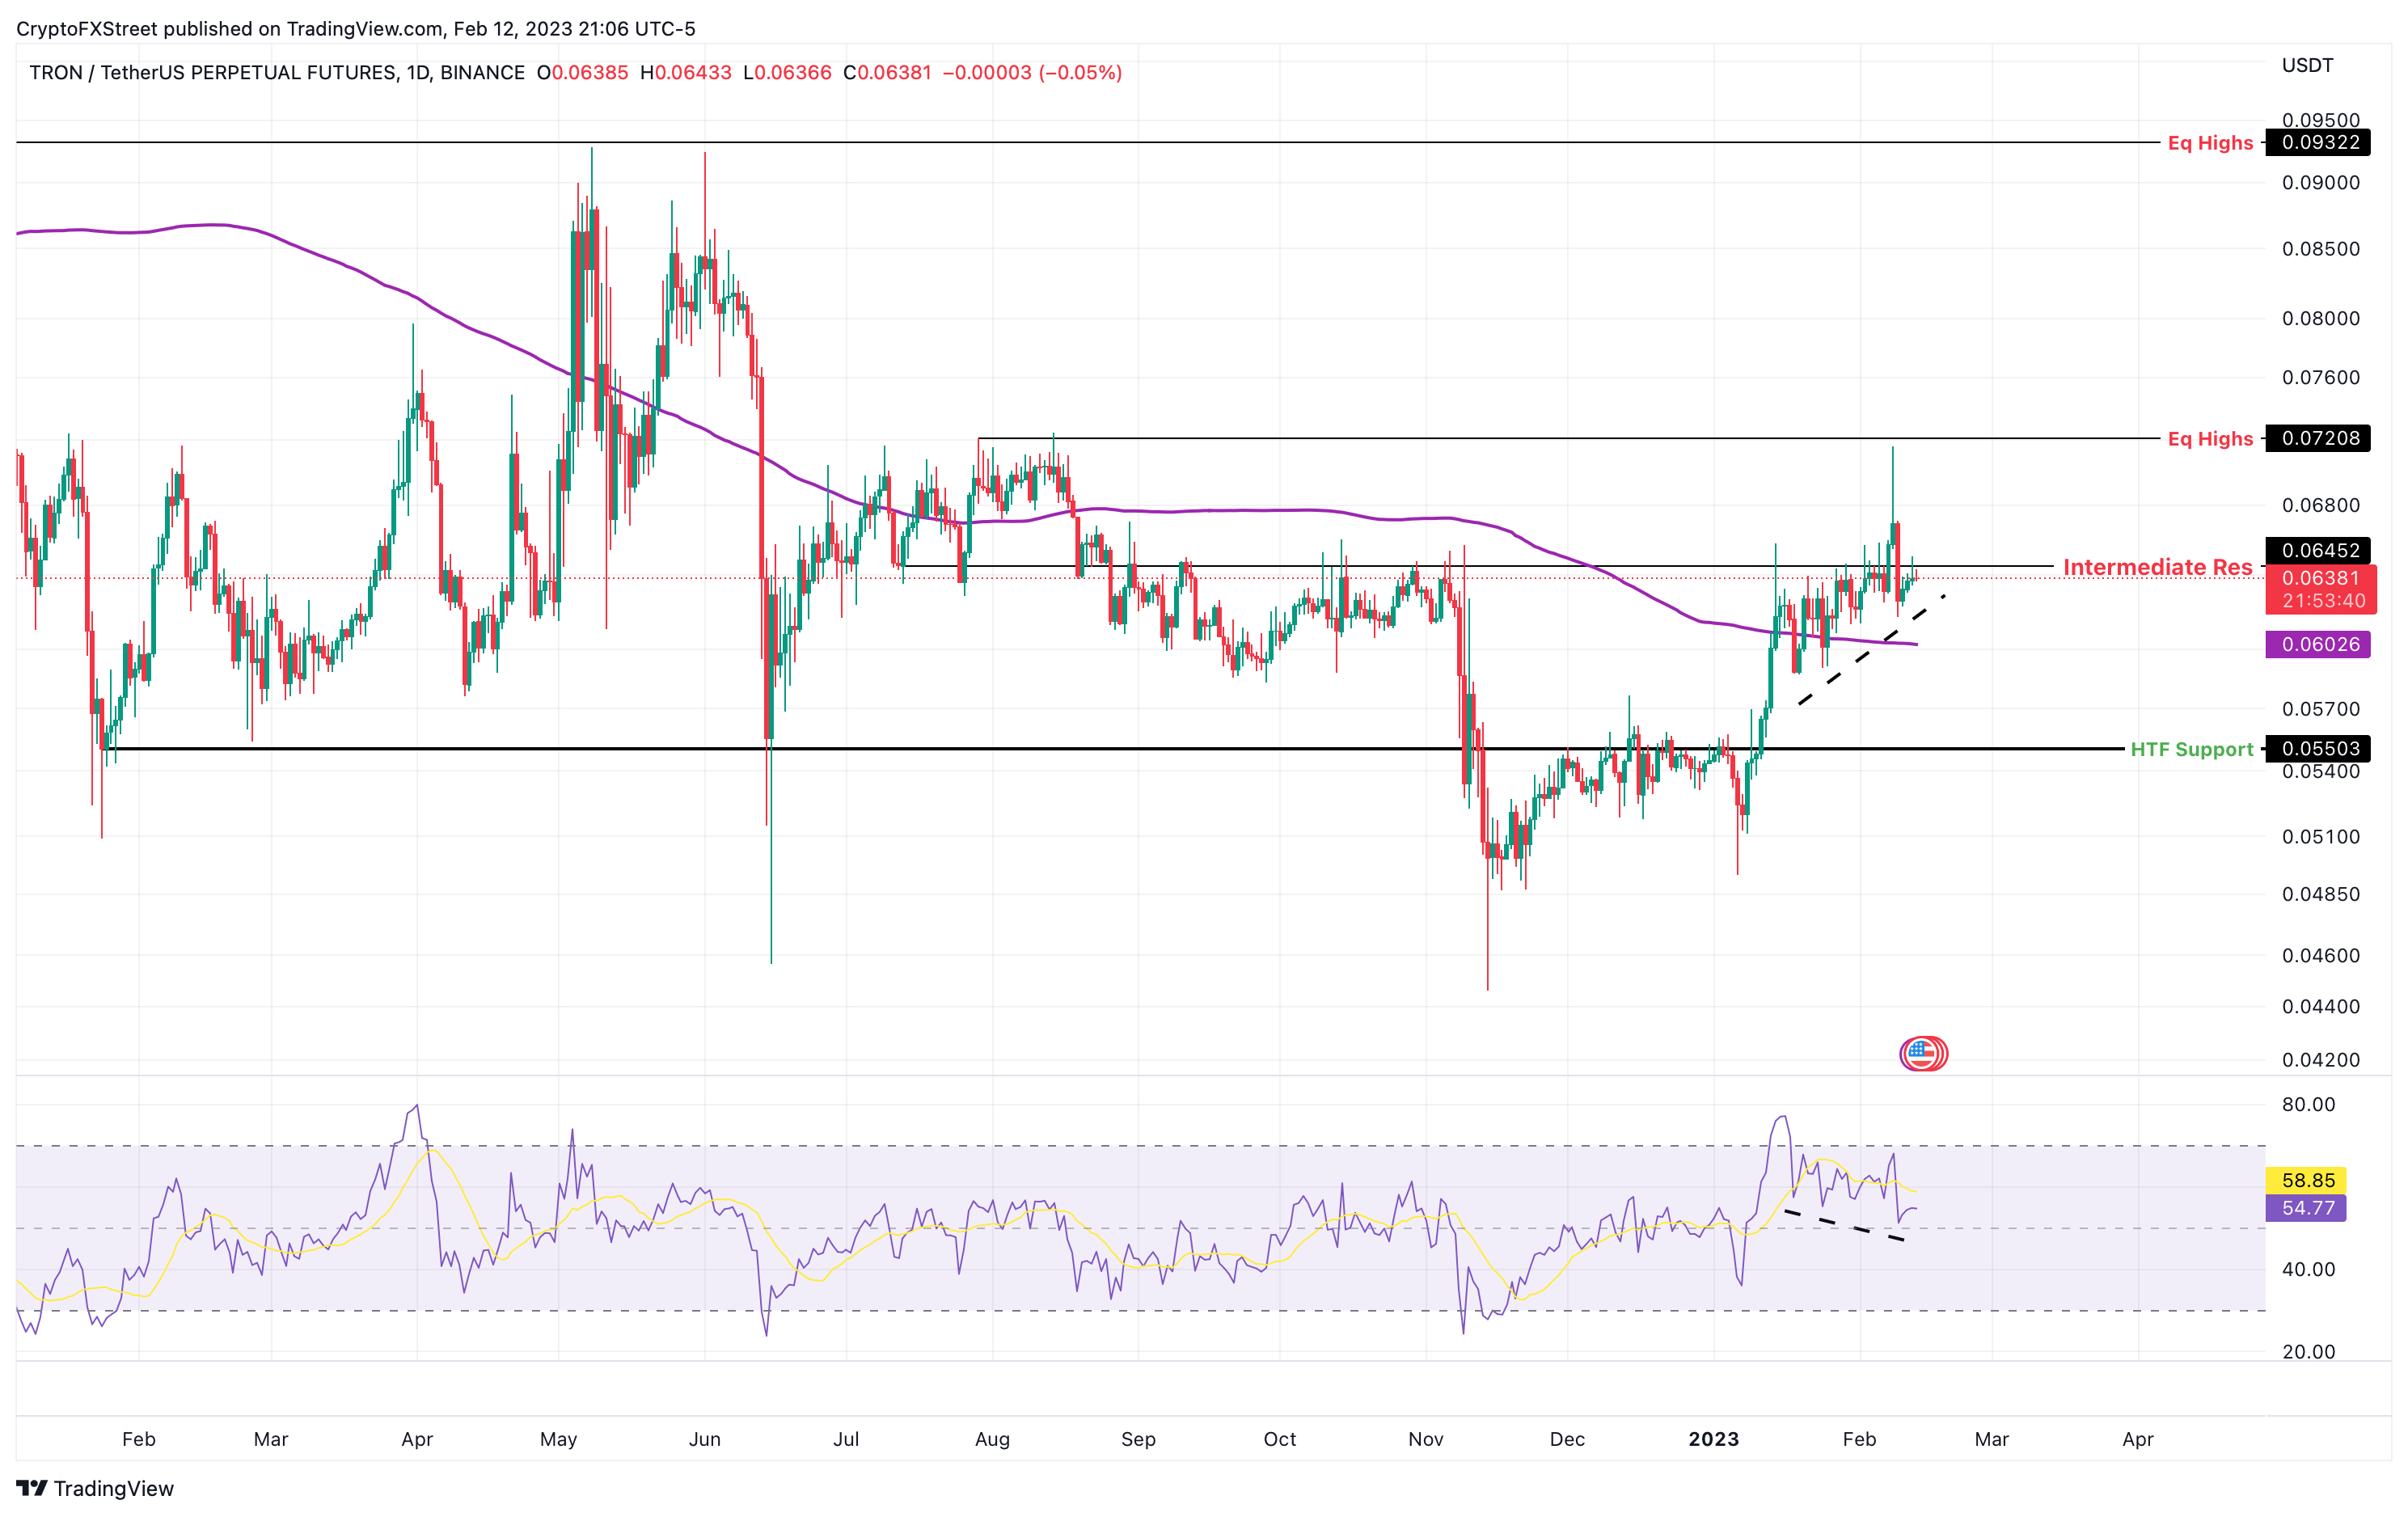
TRX/USDT 1-day chart
Enjin Coin price action also resembles TRON as it has not only moved above the 200-day SMA but is also actively signaling a hidden bullish divergence. So far, ENJ has rallied 130% in the last 40 days and has also flipped a key resistance level at $0.4121 into a support floor.
Interestingly, the 200-day SMA coincides with the aforementioned level, making it a critical level for bulls to defend. Investors can expect ENJ to resume its uptrend from this level and target the next hurdle at $0.5753, roughly 34% away from the current position at $0.4385.
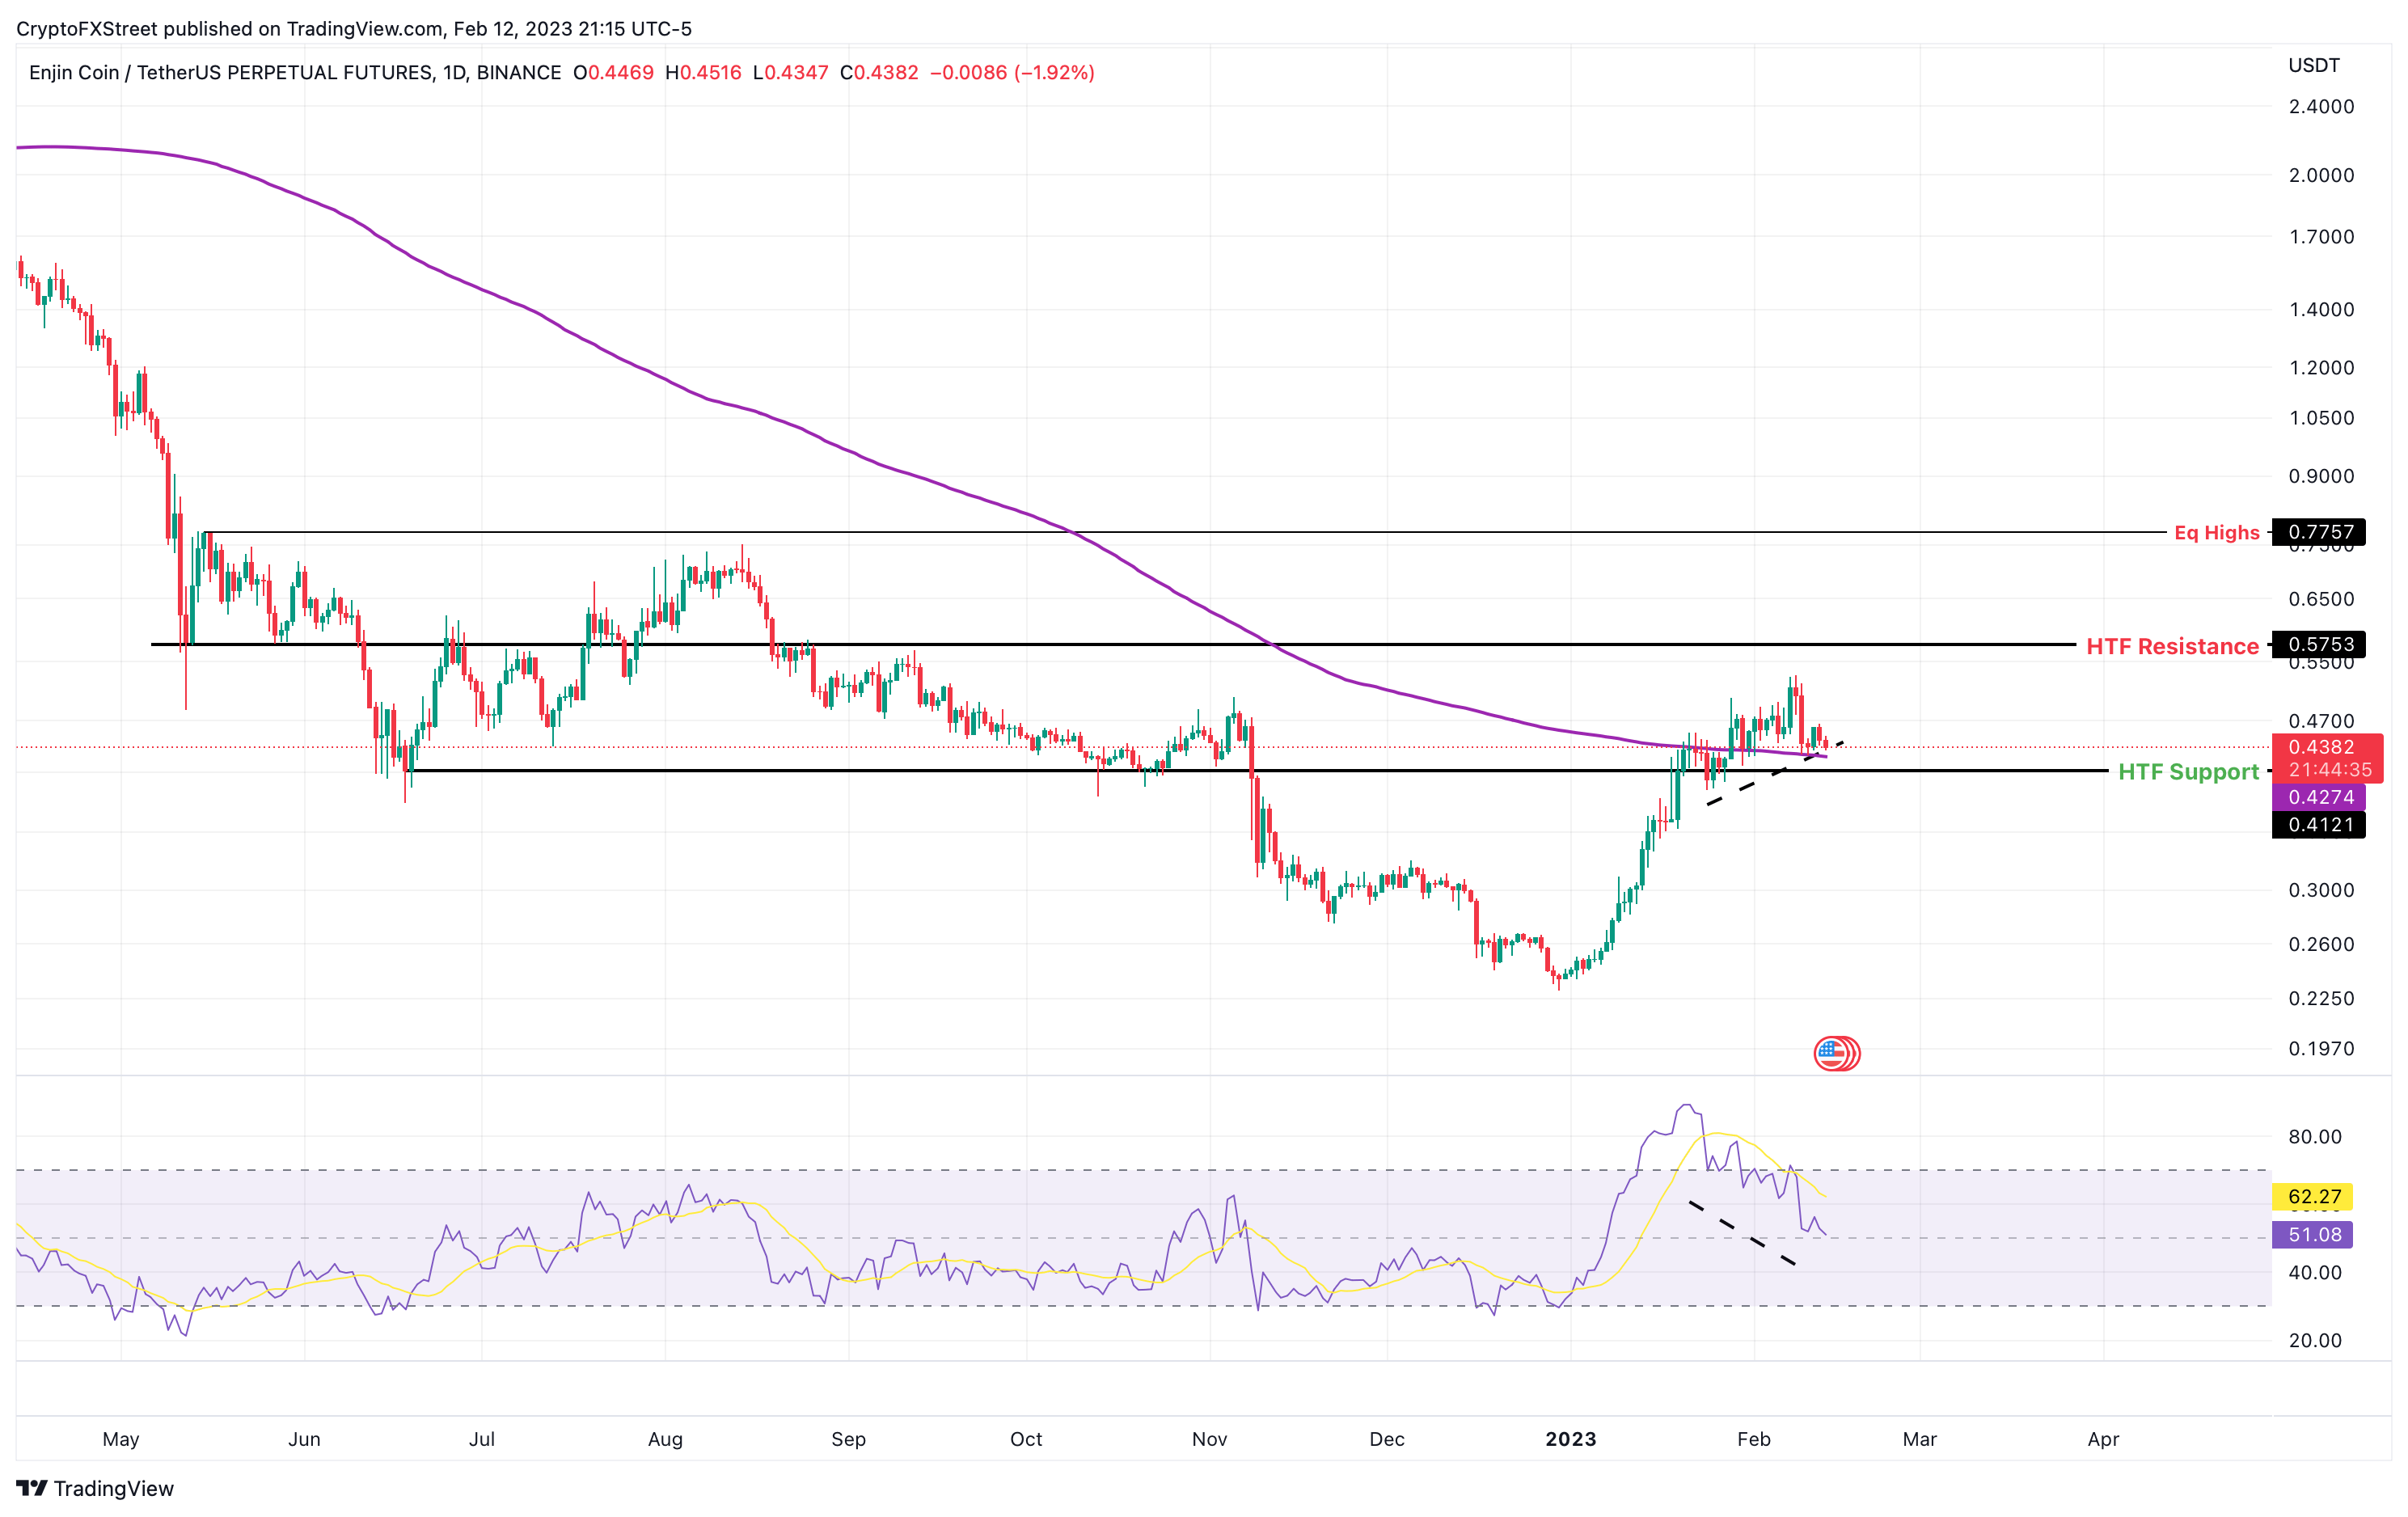
ENJ/USDT 1-day chart
Ontology price action is the third-best altcoin due to its positioning, which is above the 200-day SMA and recently flipped hurdle at $0.2124. Additionally, the altcoin shows a hidden bullish divergence with clear higher lows formed in its 79% upswing.
Therefore, a bounce off the said support level at $0.2124 will be key in triggering a 26% upswing to the $0.2592 hurdle. Although unlikely, a flip of this blockade into a support floor could see ONT tag the $0.3430 barrier, bringing the total gain from 26% to 67%.
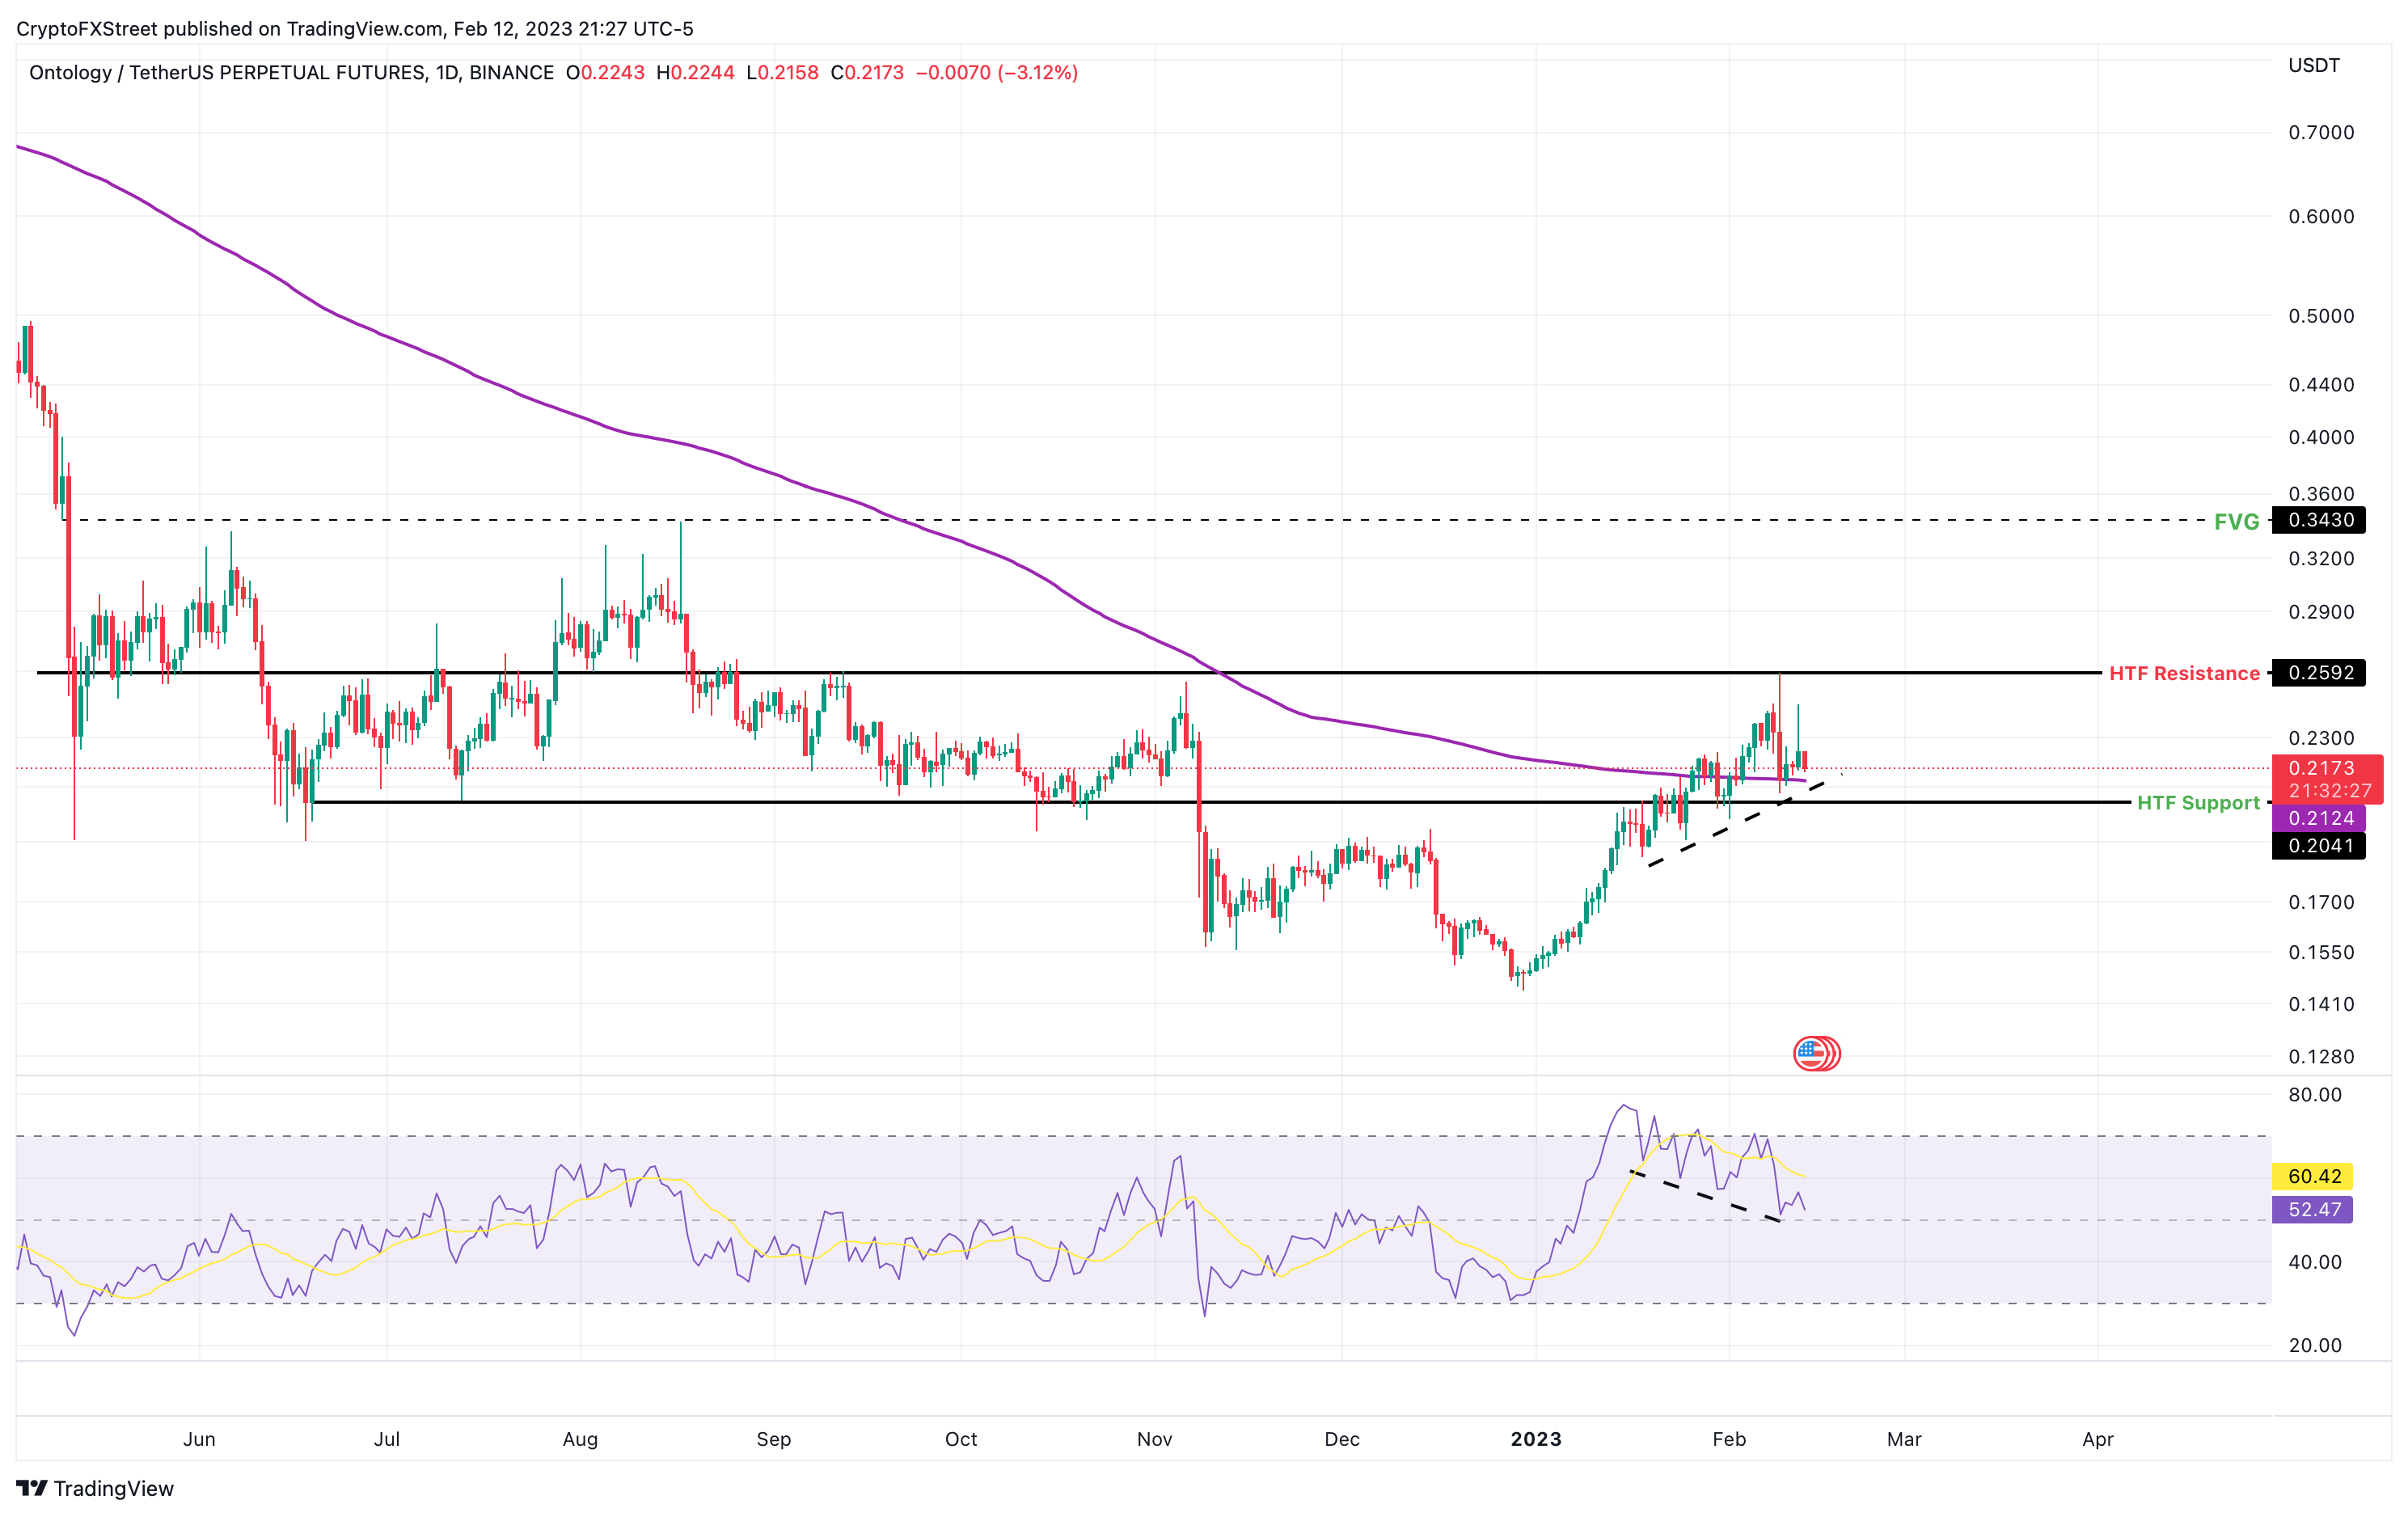
ONT/USDT 1-day chart
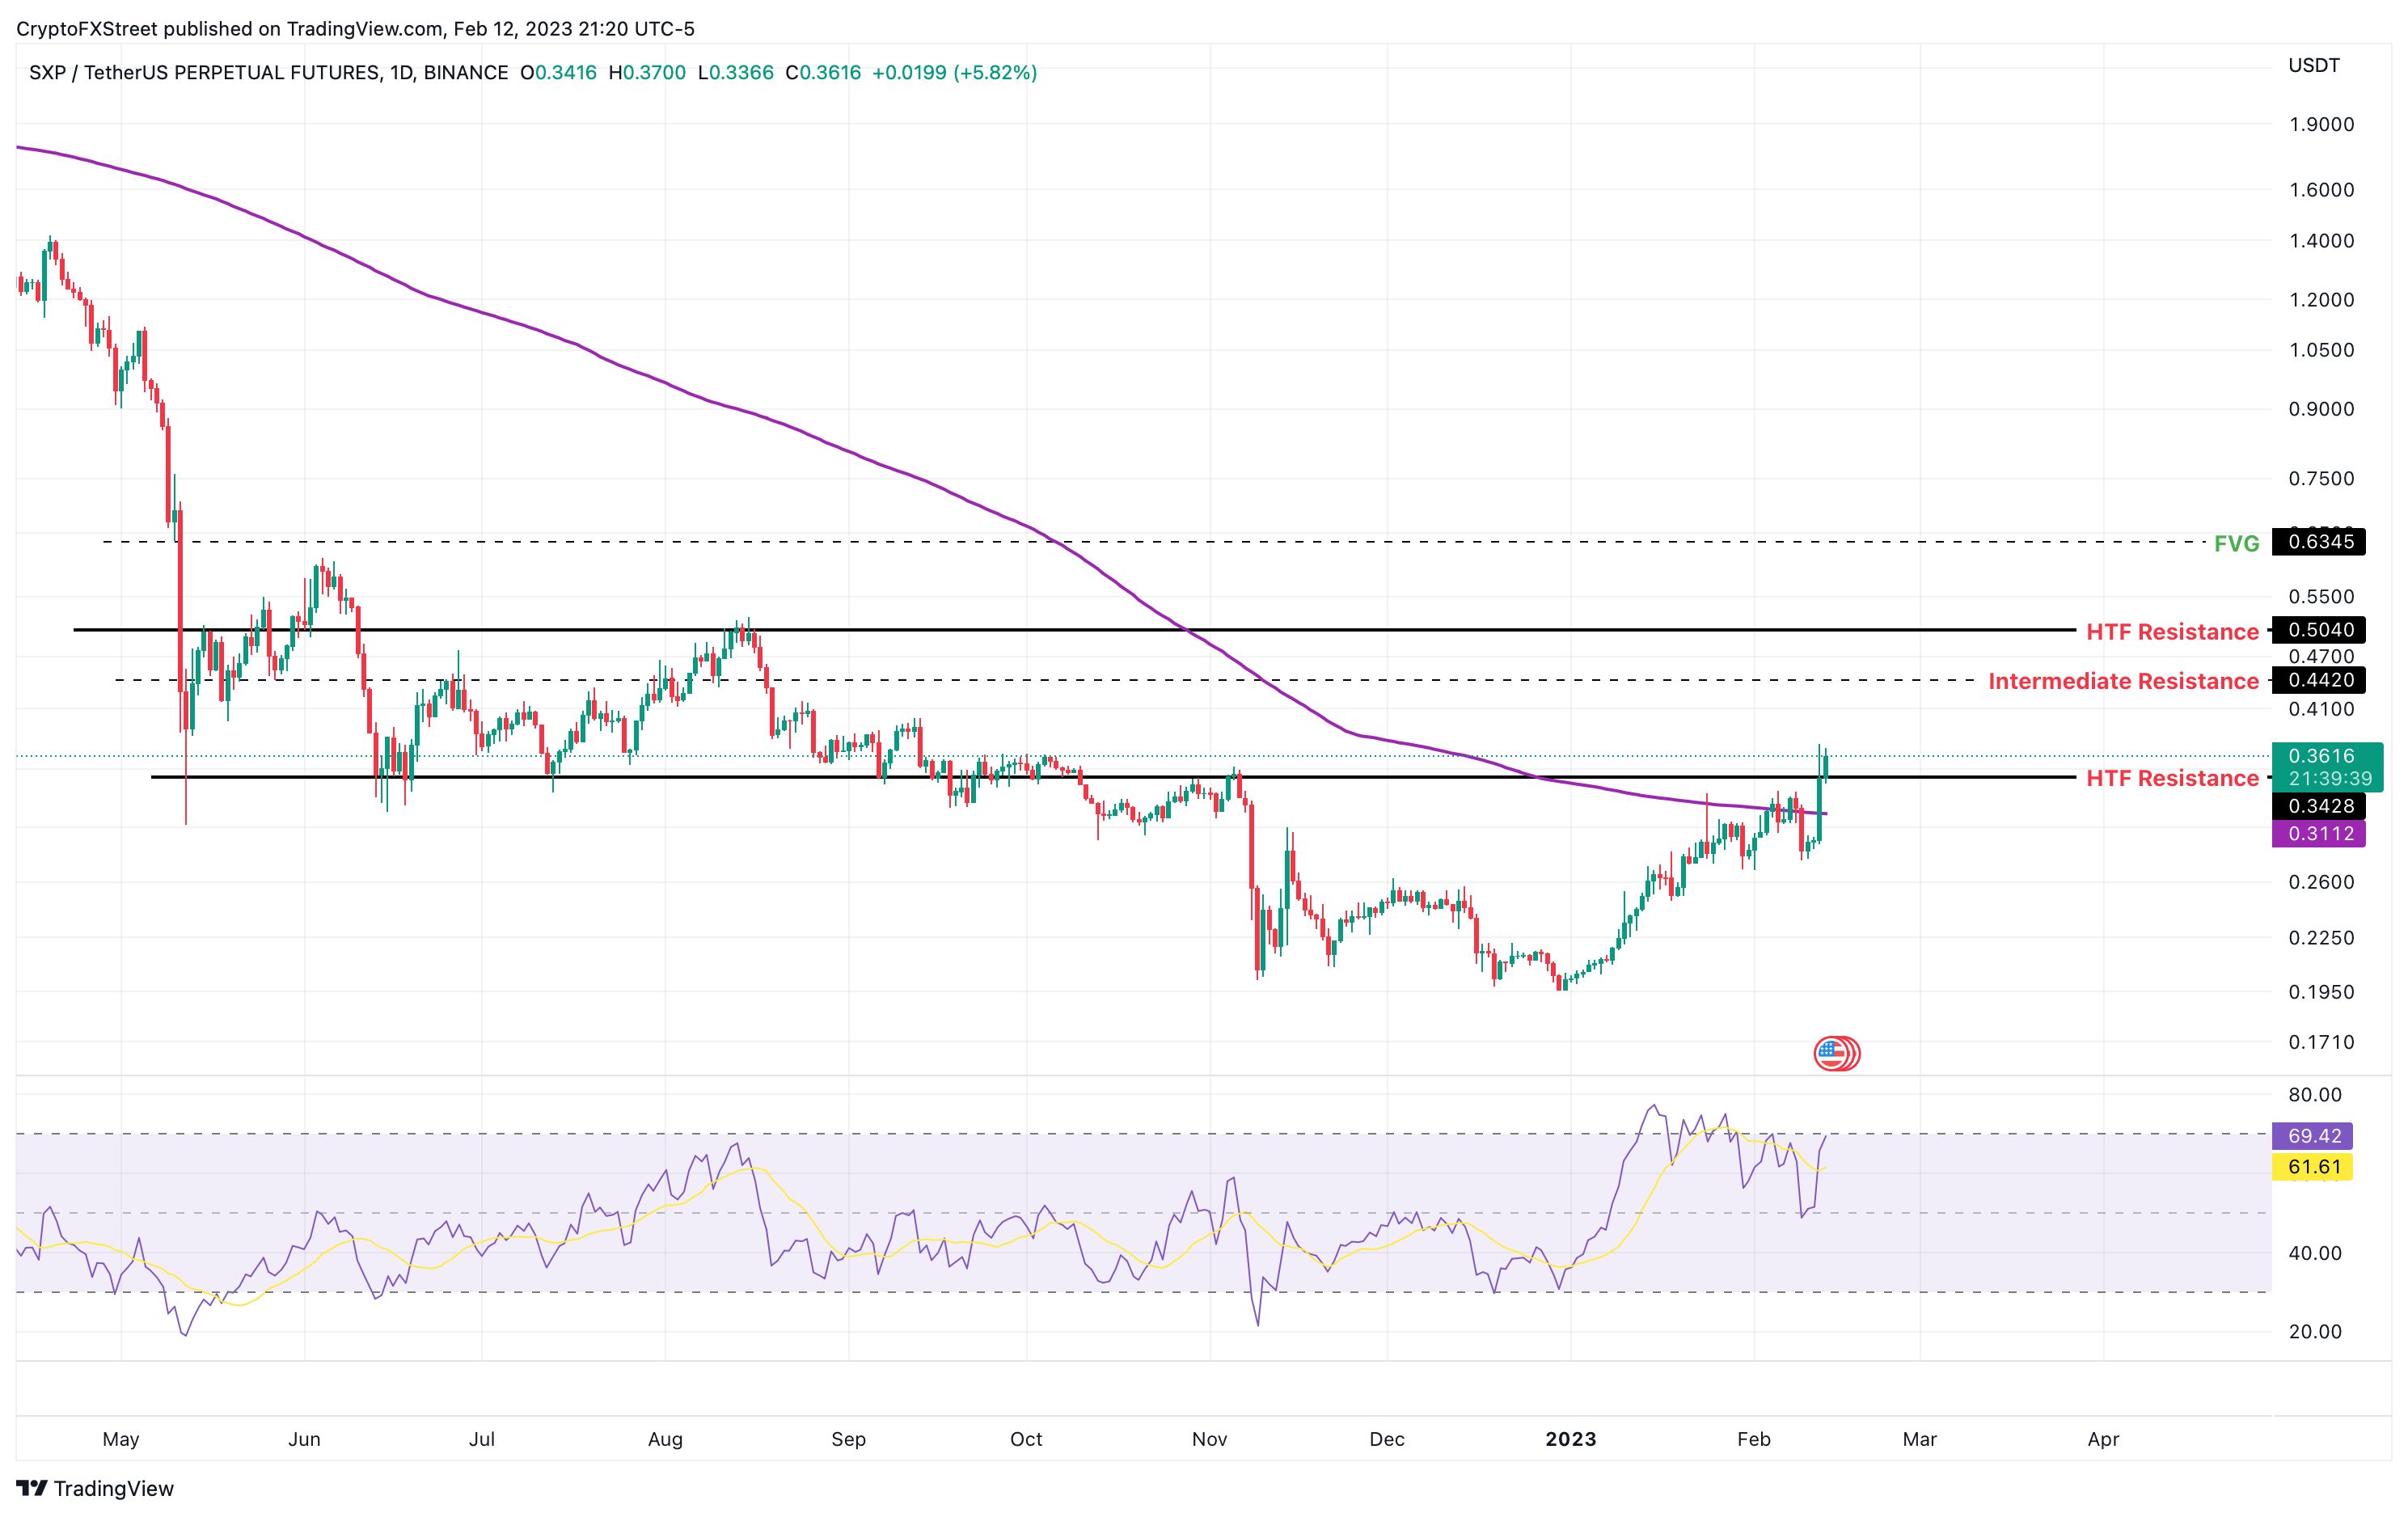
Solar price action is the fourth-best altcoin which flipped the 200-day SMA on February 12 and is primed for an uptrend. The reason why SXP is in the fourth position and not the third is that it needs to confirm a successful flip of the $0.3428 hurdle into a support floor.
A daily candlestick close above this level will confirm the presence of bulls, but a retest in case of a pullback needs to be held.
Such confirmation will be a key signal for investors to take their stance on SXP. In such a case, the Solar price can explode 46% and tag the $0.5040 hurdle, provided it overcomes the intermediate resistance level at $0.4420.
SXP/USDT 1-day chart
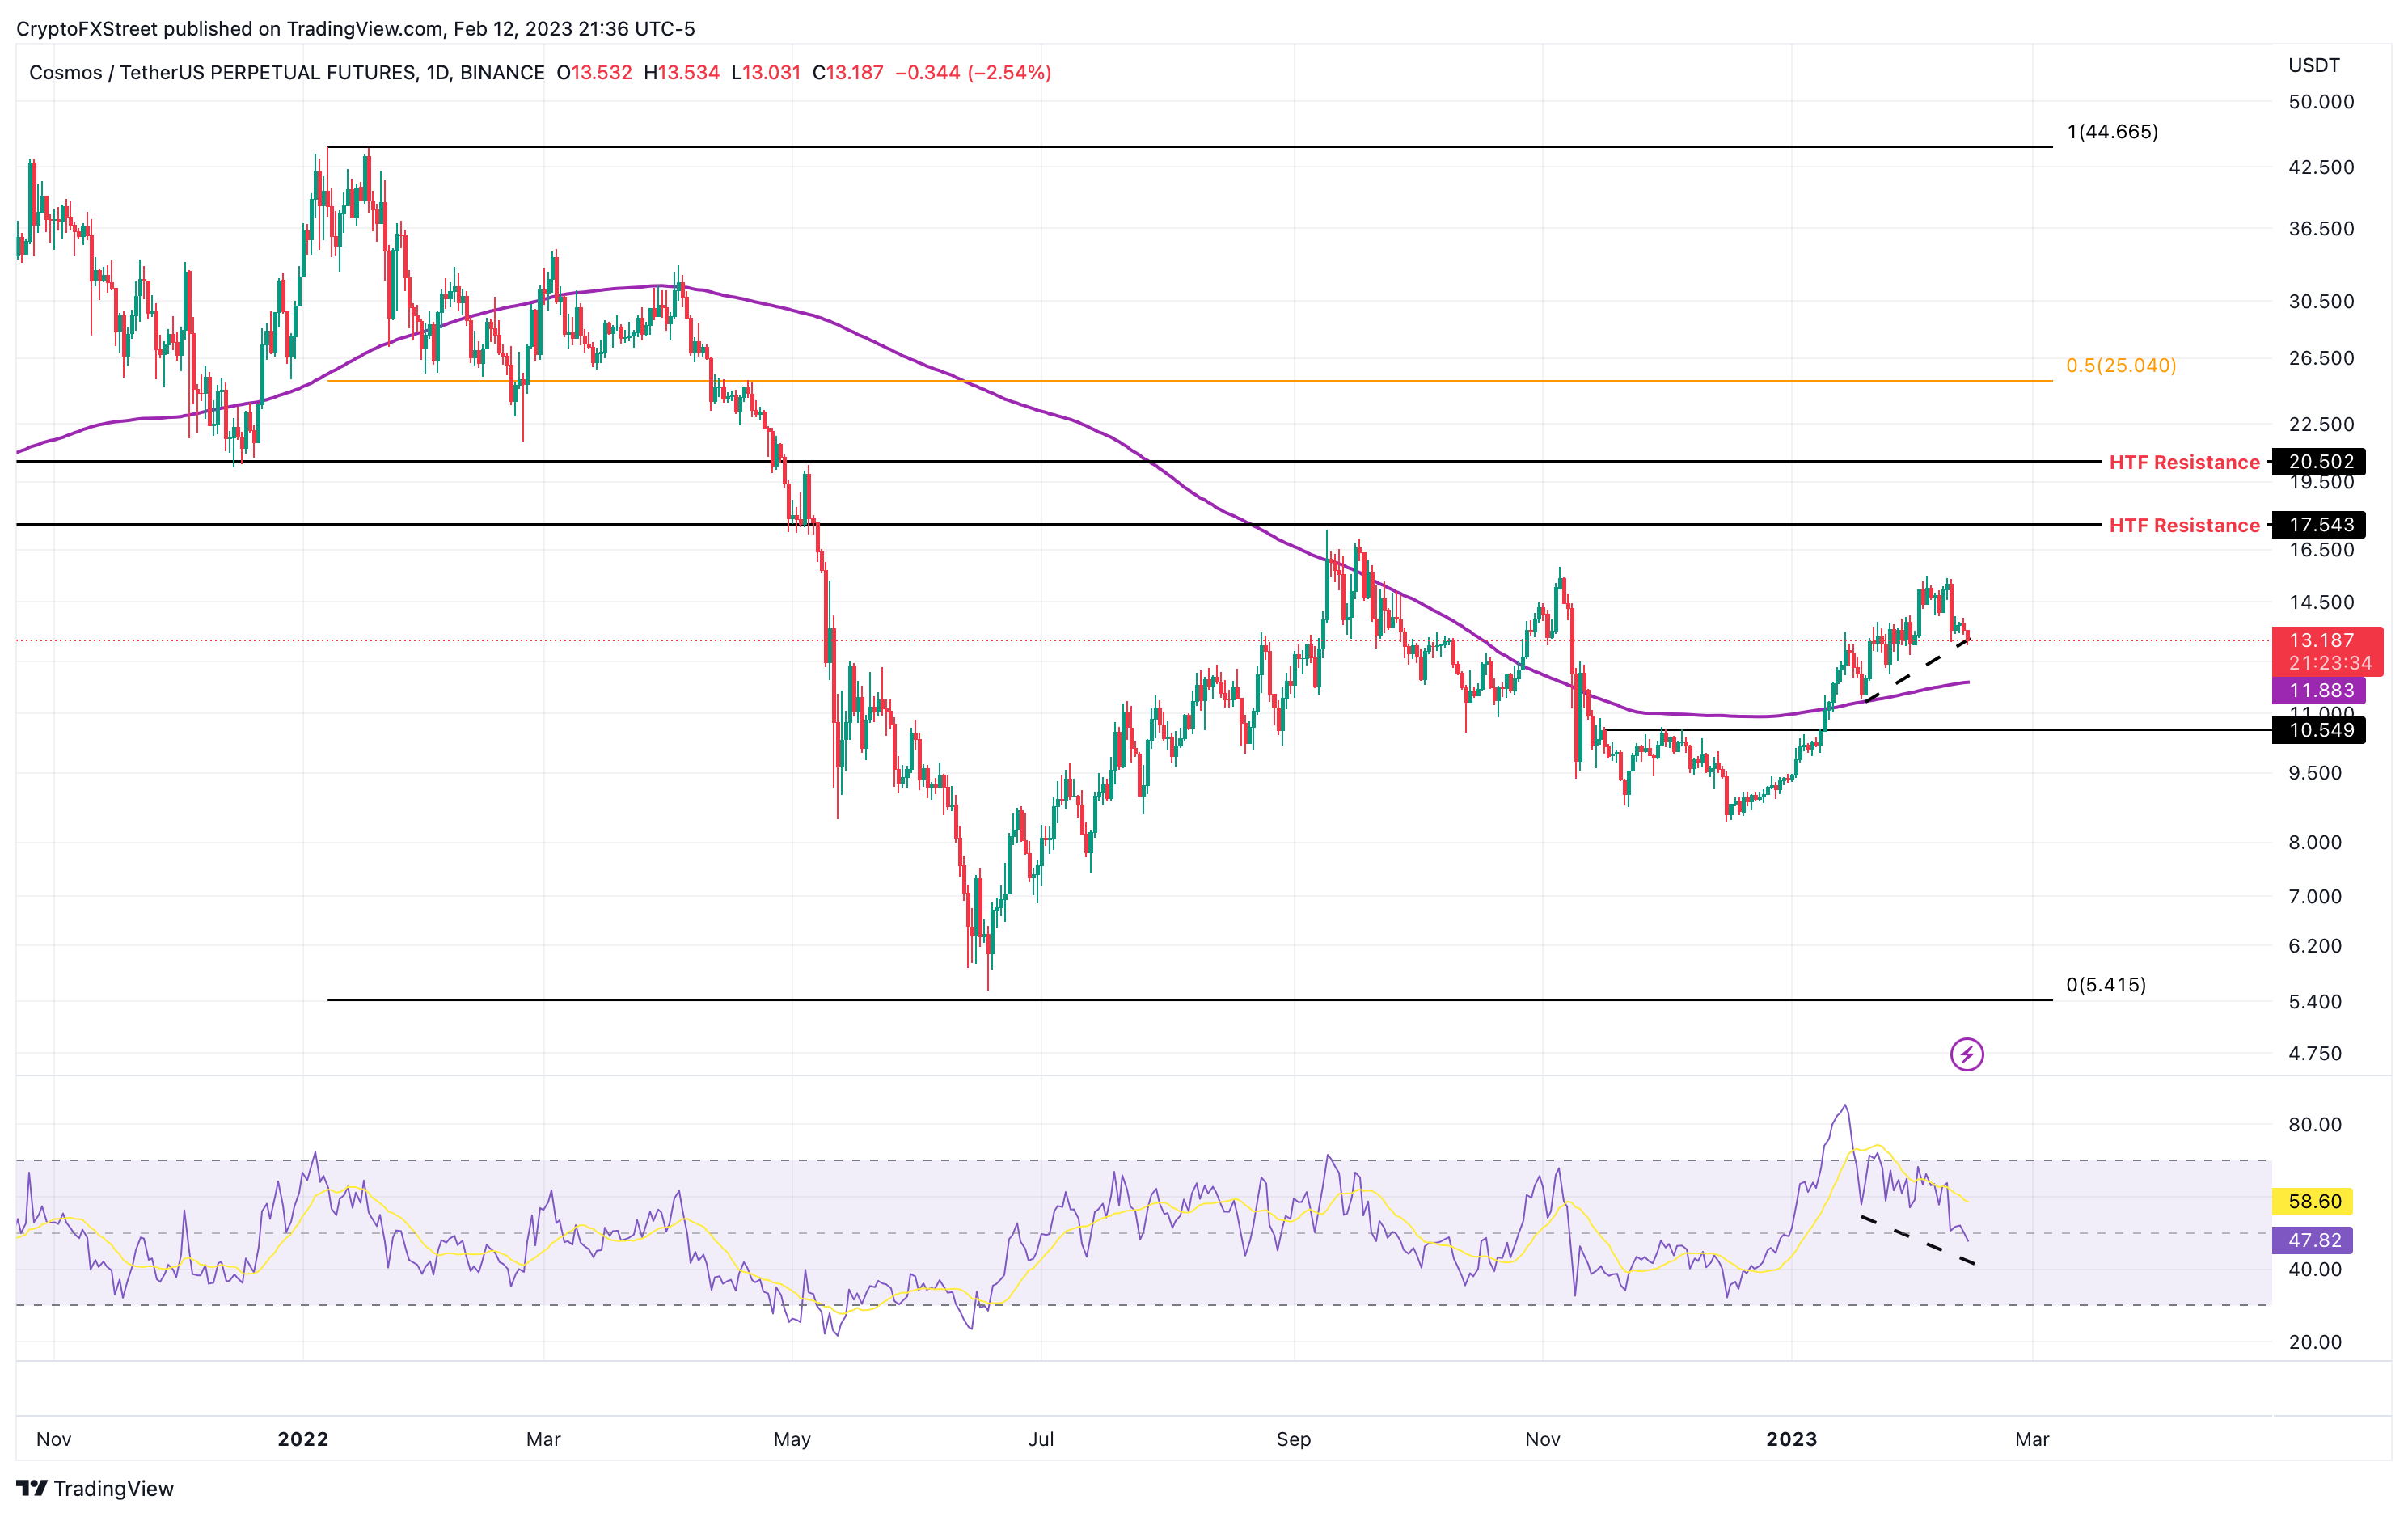
Cosmos price action is weaker than the rest of the altcoins due to the lack of distinctive higher lows, which does not confirm a hidden bullish divergence. Investors can expect ATOM to slide 9.40% lower to tag the 200-day SMA at $11.88.
Additionally, the RSI indicator for altcoins mentioned above shows the promise of a bounce at the 50-level. But the momentum indicator has already slipped below the neutral point for ATOM, indicating the presence of sellers. However, if bulls defend the $11.88 level, investors can expect a 48% bounce that propels Atom price to retest the $17.54 hurdle.
ATOM/USDT 1-day chart
While the blanket bullish statement and thesis explained above are exciting, investors need to understand that these altcoins are at the mercy of liquidity and the ongoing bull run for Bitcoin price. The bullish trend will likely come undone should capital flow out of Bitcoin — the largest cryptocurrency by market capitalization, and produce a daily candlestick close below the 200-day SMA at $19,700. In such a case, the bullish thesis detailed above will become null and void.
If this development comes to pass, investors can expect TRON, ENJ, ONT, SXP and ATOM to retrace to the immediate support levels seen in their respective charts.
This video explains how Bitcoin price move could affect altcoins
Share: Cryptos feed


 Bitcoin
  Ethereum
  Tether
  USDC
USDC  Dogecoin
  Cardano
  Bitcoin Cash
  Polygon
  Litecoin
  LEO Token
  Hedera
  Stellar
  Cosmos Hub
  OKB
OKB  Maker
Maker  Algorand
  NEO
NEO  Gate
Gate  Synthetix Network
  KuCoin
  IOTA
IOTA  Tether Gold
  TrueUSD
  Holo
Holo  Enjin Coin
  Ravencoin
  0x Protocol
  Siacoin
  Basic Attention
  Ontology
  Zcash
Zcash  Decred
  Lisk
Lisk  Waves
Waves  DigiByte
  Numeraire
  Status
  Nano
Nano  Pax Dollar
  Steem
Steem  OMG Network
  BUSD
BUSD  Ren
Ren  Bytom
Bytom  Bitcoin Diamond
  HUSD
HUSD  Energi
  Augur
Augur