


LUNC Price Analysis: LUNC Price Entering a Bullish Phase?

- LUNC price is currently trading at $0.000122 while seeing a change of 4.94% in 24-hour trading volume.
- LUNC price increased 0.18% in the last 24 hours.
- LUNC price might see an increase in the upcoming days
Terra Classic (LUNC) is currently trading below the 200-day EMA while consistently taking resistance near the supply zone. It made a bullish double-bottom pattern near the demand zone around $0.000115. It has multiple resistance levels going up. Although if the LUNC price crosses above the resistance levels successfully with a bullish momentum the price can make a bullish uptrend while gaining 30 percent of its value back. The double bottom pattern is also a bullish reversal pattern which suggests that the trend can turn toward the bull’s favor.
LUNC/USDT price is trading near the supply zone on the (Daily Timeframe
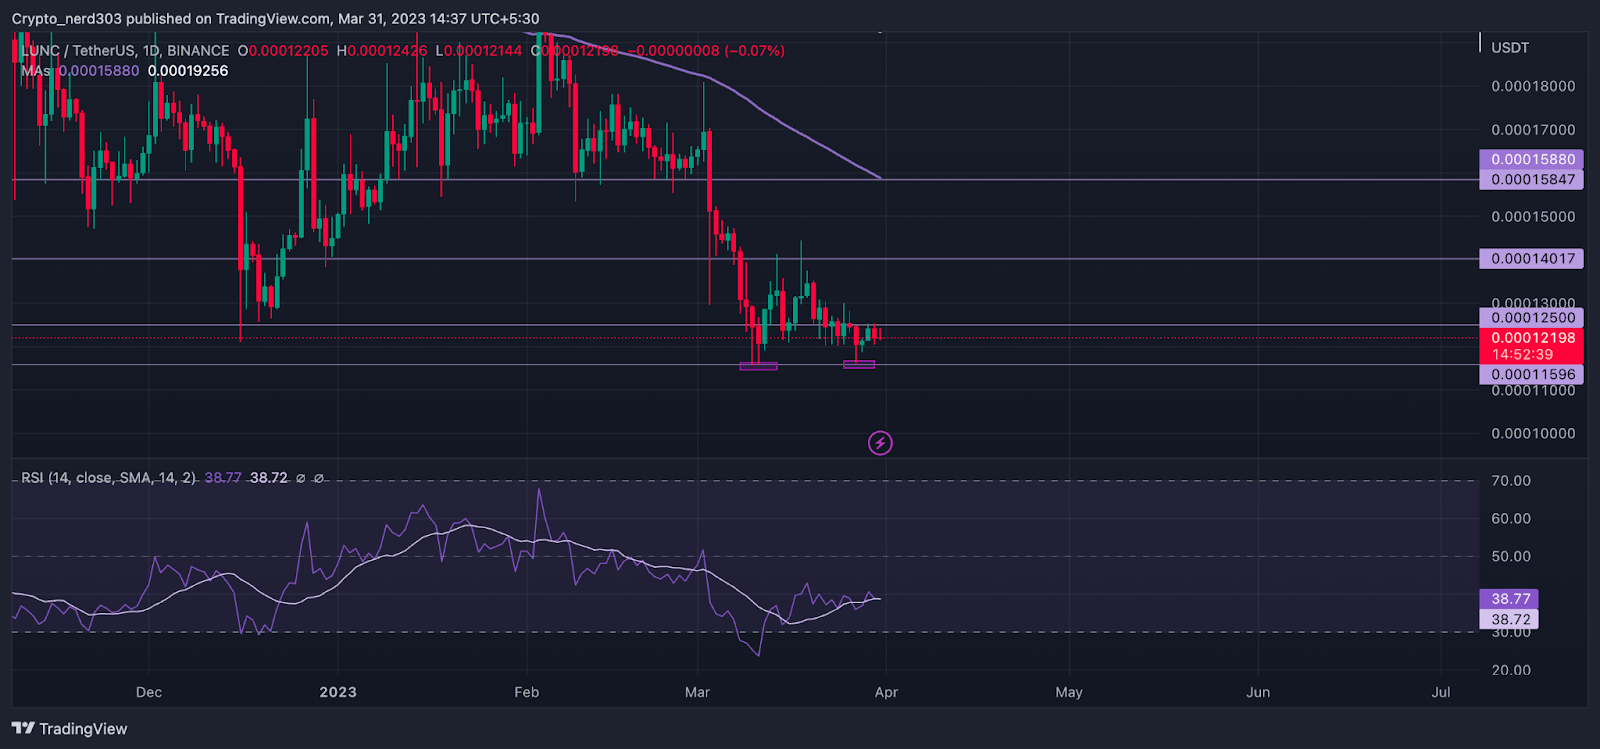
Source: LUNC/USDT by TradingView
LUNC price after crossing below the 200 and 100 EMA near early November has been under the bear’s influence for the last few months. Although after taking support from the price of $0.0001300 the LUNC token gained buyers’ support and after making a bullish three-white soldier candlestick pattern. The price made a bullish upturn while gaining 61 percent of its value back and after crossing above 200 EMA the LUNC price took a bearish correction following which it made an extremely bullish candle which was 24 percent longer.
Although despite the bullish movement the buyers were unable to support the price above 200 EMA and after making a bearish dark cloud cover candlestick the price fell below the major key averages after making several attempts to make a comeback the sellers started stepping in the price action and it took a downturn of 28 percent.
Technical Analysis ( 4 Hour Timeframe )
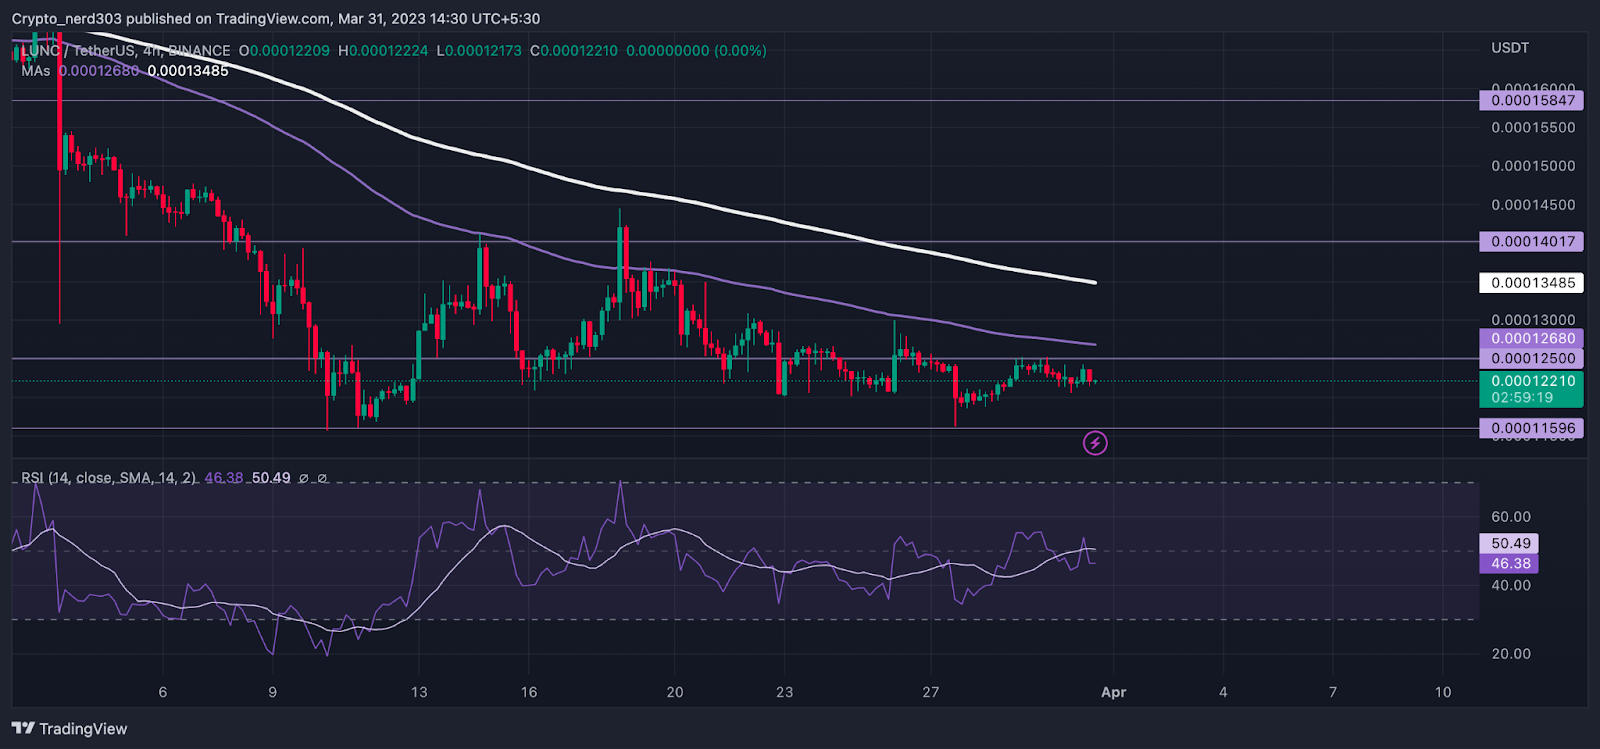
Source: LUNC/USDT by TradingView
In the 4-hour timeframe, the LUNC price is trading below the 200 EMA while also consistently taking resistance from the 100 EMA. Although it is also taking support at the same level around price $0.000115 multiple times making a double bottom instead of making a lower low with a lower high pattern which will create pressure in the price action as the movements start becoming smaller. This suggests that the price can make a breakout.
The RSI line is currently making a higher high and higher low pattern which is a bullish indication. The RSI line is currently trading around 46.38 points near the median line while taking resistance from the 14 SMA which is trading around 50.49 points.
Technical levels –
Support – $0.000115
Resistance – $0.000126
Disclaimer
The views and opinions stated by the author, or any people named in this article, are for informational purposes only, and they do not establish financial, investment, or other advice. Investing in or trading crypto assets comes with a risk of financial loss.


 Bitcoin
  Ethereum
  Tether
  USDC
USDC  Dogecoin
  Cardano
  Bitcoin Cash
  Polygon
  Litecoin
  LEO Token
  Hedera
  Cosmos Hub
  Stellar
  OKB
OKB  Maker
Maker  Algorand
  NEO
NEO  Gate
Gate  KuCoin
  Synthetix Network
  IOTA
IOTA  Tether Gold
  TrueUSD
  Enjin Coin
  Holo
Holo  0x Protocol
  Ravencoin
  Siacoin
  Basic Attention
  Zcash
Zcash  Decred
  Ontology
  Lisk
Lisk  Waves
Waves  DigiByte
  Status
  Numeraire
  Nano
Nano  Pax Dollar
  Steem
Steem  OMG Network
  BUSD
BUSD  Ren
Ren  Bitcoin Diamond
  Bytom
Bytom  HUSD
HUSD  Energi
  Augur
Augur