


QNT Price Analysis: Will Bears be Prominent in The QNT Price?

- 1 The QNT price is currently trading at $120.1 while seeing a change of -78% in 24-hour trading volume.
- 2 Quant is observing a decline of 1.20% in the last 24 hours.
At present, QNT is trading on a bullish trend under the 200 MA and EMA. After gaining buyers’ support near $40 the price of QNT made an attempt to break out of the bear’s influence. The price was successful in this attempt as after taking the support the price made an extremely bullish rally and gained more than 98% of its value. Despite bullish optimism in the price action QNT’s price was not able to sustain above its major resistance level at 200 EMA.
After taking rejection from the 200 EMA price, the asset made a 30% correction. However, sellers’ attempt to take control of the trend, QNT’s price gained support from its previous consolidation point. It started making a higher high and higher low pattern trading on a bull trend. Observing the price action, a bullish trend might be imminent.
QNT Price Can Take a Bearish Correction on The Uptrend

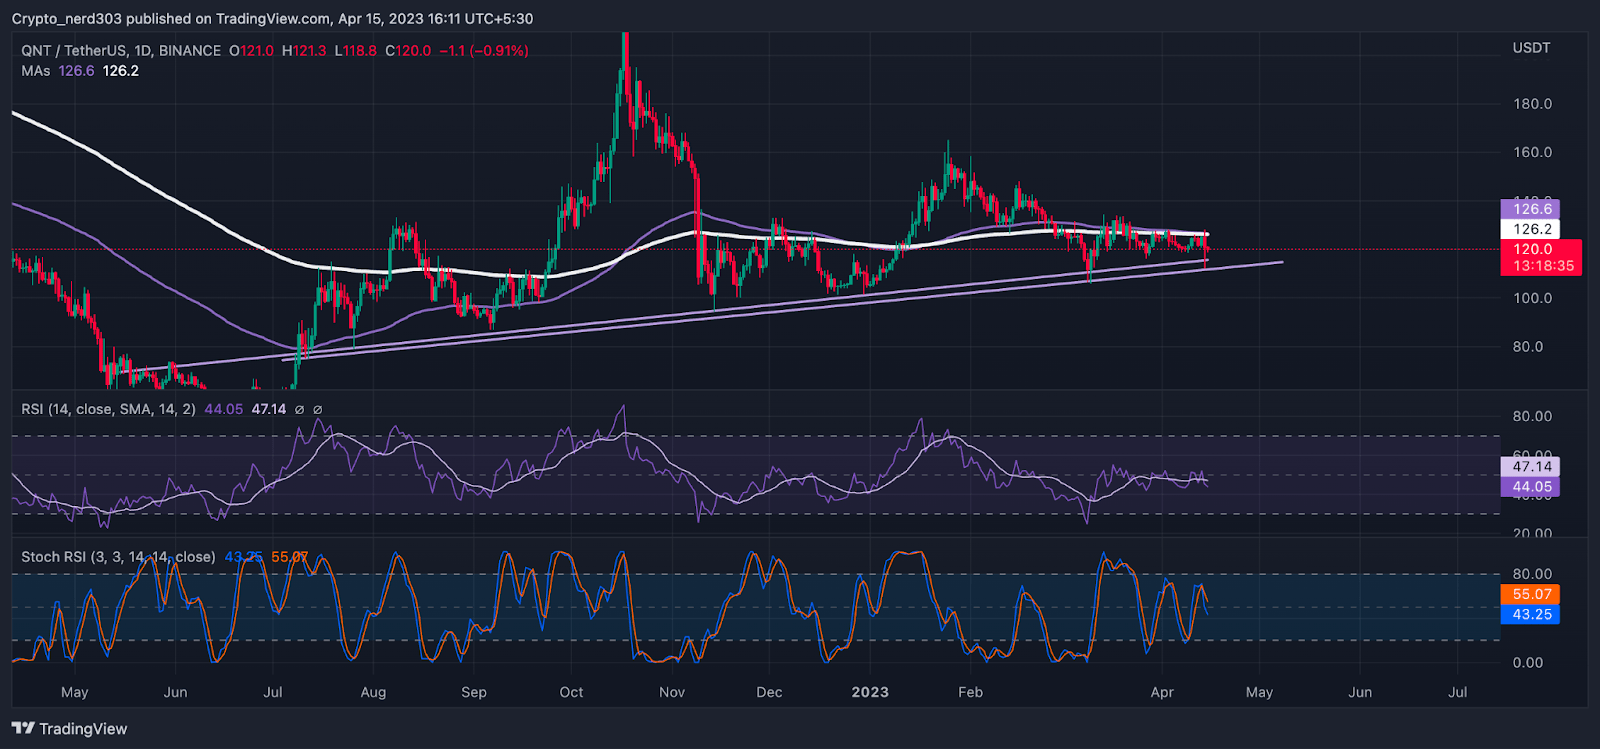
Source: QNT/USDT by TradingView
In the previous analysis, our analysts anticipated that QNT price can take a bearish correction from the $126 price point as the price was taking correction from the 200 and 100 EMA and the RSI was taking a reversal from the median line also the stochastic RSI was trading in the demand zone. The prediction was realized as the price gave a 10% downfall after getting rejected from the 200 and 100 EMA.
Technical Analysis
Source: QNT/USDT by TradingView
As of now, QNT price is making a higher high and higher low pattern after taking support from the $80 price near mid-July.
QNT is taking resistance from the 100 and 200 EMA. The current support levels for the QNT price are around $116 and its major support level is at $100. Resistance point for QNT is near $130 and its major resistance is at $160.
The RSI line is moving above the median line, taking constant resistance from it. RSI line is currently moving around 44 points, while the 14 SMA is providing resistance at near 47 points.
Conclusion
As per the analysis, The price is currently taking rejection from 200 EMA and 100 EMA. As the price is making a downward curve while trading under major key averages it presents an outlook of a bearish correction. The QNT price might continue its bearish trend before taking a reversal.
Technical levels
Support – $116 and $100
Resistance – $130 and $160
Disclaimer
The views and opinions stated by the author, or any people named in this article, are for informational purposes only, and they do not establish financial, investment, or other advice. Investing in or trading crypto assets comes with a risk of financial loss.


 Bitcoin
  Ethereum
  Tether
  USDC
USDC  Dogecoin
  Cardano
  Bitcoin Cash
  Polygon
  Litecoin
  LEO Token
  Hedera
  Cosmos Hub
  Stellar
  OKB
OKB  Maker
Maker  Algorand
  NEO
NEO  Gate
Gate  KuCoin
  Synthetix Network
  IOTA
IOTA  Tether Gold
  TrueUSD
  Enjin Coin
  Holo
Holo  Ravencoin
  0x Protocol
  Siacoin
  Basic Attention
  Zcash
Zcash  Ontology
  Decred
  Lisk
Lisk  Waves
Waves  DigiByte
  Pax Dollar
  Status
  Nano
Nano  Numeraire
  Steem
Steem  OMG Network
  BUSD
BUSD  Ren
Ren  Bitcoin Diamond
  Bytom
Bytom  HUSD
HUSD  Energi
  Augur
Augur