

Shiba Inu (SHIB) Price Finally Breaks Resistance – What’s Next?

The Shiba Inu (SHIB) price cleared an important resistance area. It could be in the first steps of a more significant upward movement.
The SHIB price is still struggling to move above the $0.0000110 resistance area. Doing so would confirm that the upward movement is in full swing. BeinCrypto Looks at key indicators to determine what’s next for Shiba Inu’s price.
Shiba Inu (SHIB) Price Clears Crucial Resistance
The daily time frame for Shiba Inu provides a bullish outlook. There are two main reasons for this.
Firstly, the Shiba Inu coin price broke out from a long-term descending resistance line that had been in place for 53 days. Breakouts from these structures usually mean that the previous correction has ended and a new upward movement is in store. In the case of SHIB, it likely means that the correction that began in February has now ended.
Secondly, the daily Relative Strength Index (RSI) moved above 50. The RSI is a momentum indicator, and movements above 50 are considered signs of a bullish trend. The RSI is a tool that helps traders understand if a crypto is overvalued or undervalued by measuring how quickly its price is changing. Furthermore, It looks at how fast and how big the price has moved recently to figure out if it might be time to buy or sell the crypto
Therefore, the daily time frame suggests that the trend is bullish, and an upward movement is expected. If this occurs, the next resistance would be at $0.0000135, the 0.618 Fib retracement resistance level. Fibonacci retracement levels operate as a set of horizontal lines derived from the Fibonacci sequence, which indicate areas where support and resistance may be encountered.
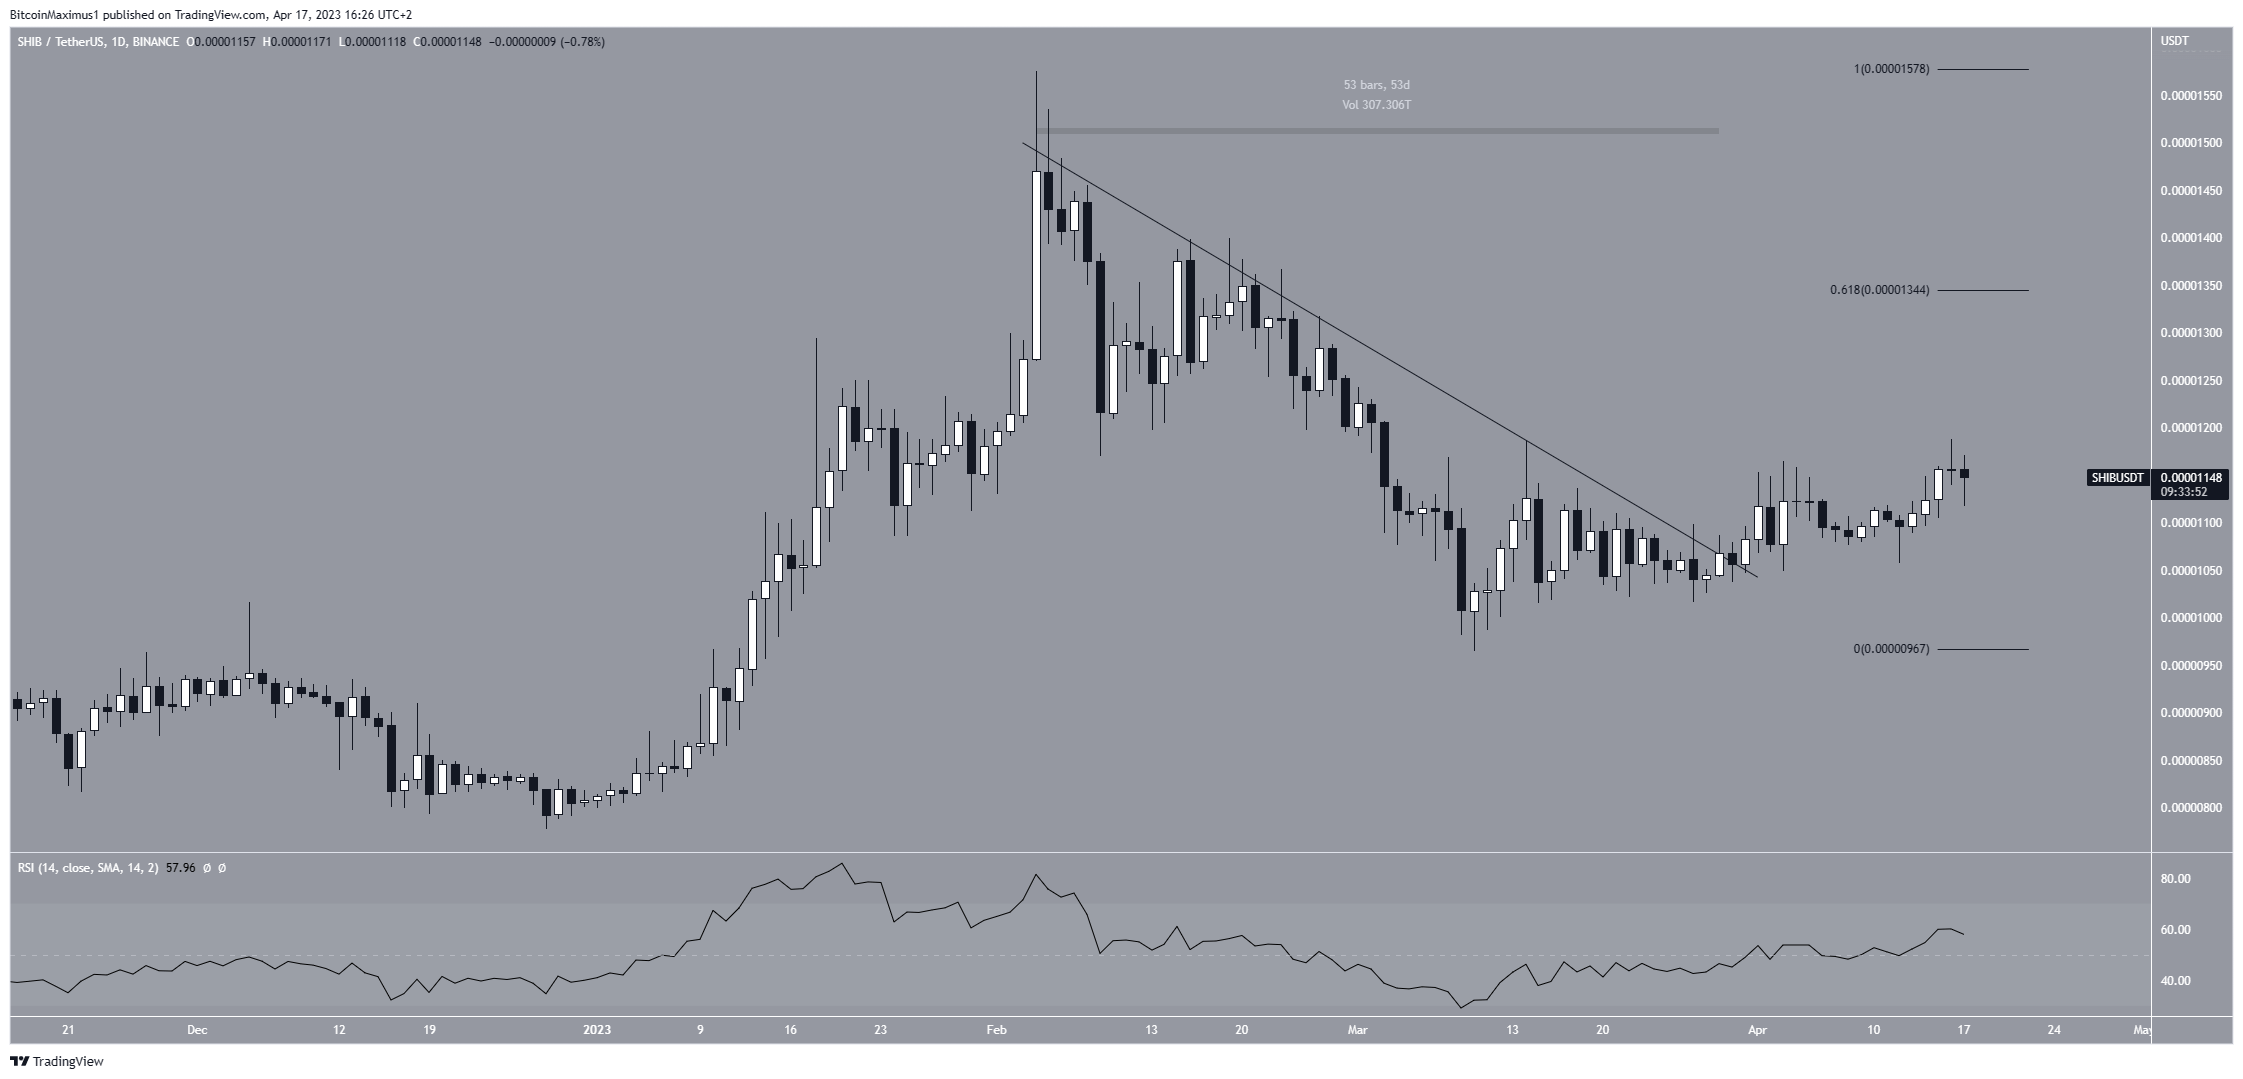
SHIB/USDT Daily Chart. Source: TradingView
Shiba Inu (SHIB) Price Prediction
The technical analysis from the short-term six-hour time frame supports the bullish outlook from the daily one. The main reason for this is the creation of an ascending triangle. The ascending triangle is considered a bullish pattern that leads to breakouts the majority of the time.
The meme coin bounced at the triangle’s support line on April 12 (green icon) and is currently in the process of breaking out. A breakout that travels the entire patterns height would take the price to $0.0000135 (black arrow).
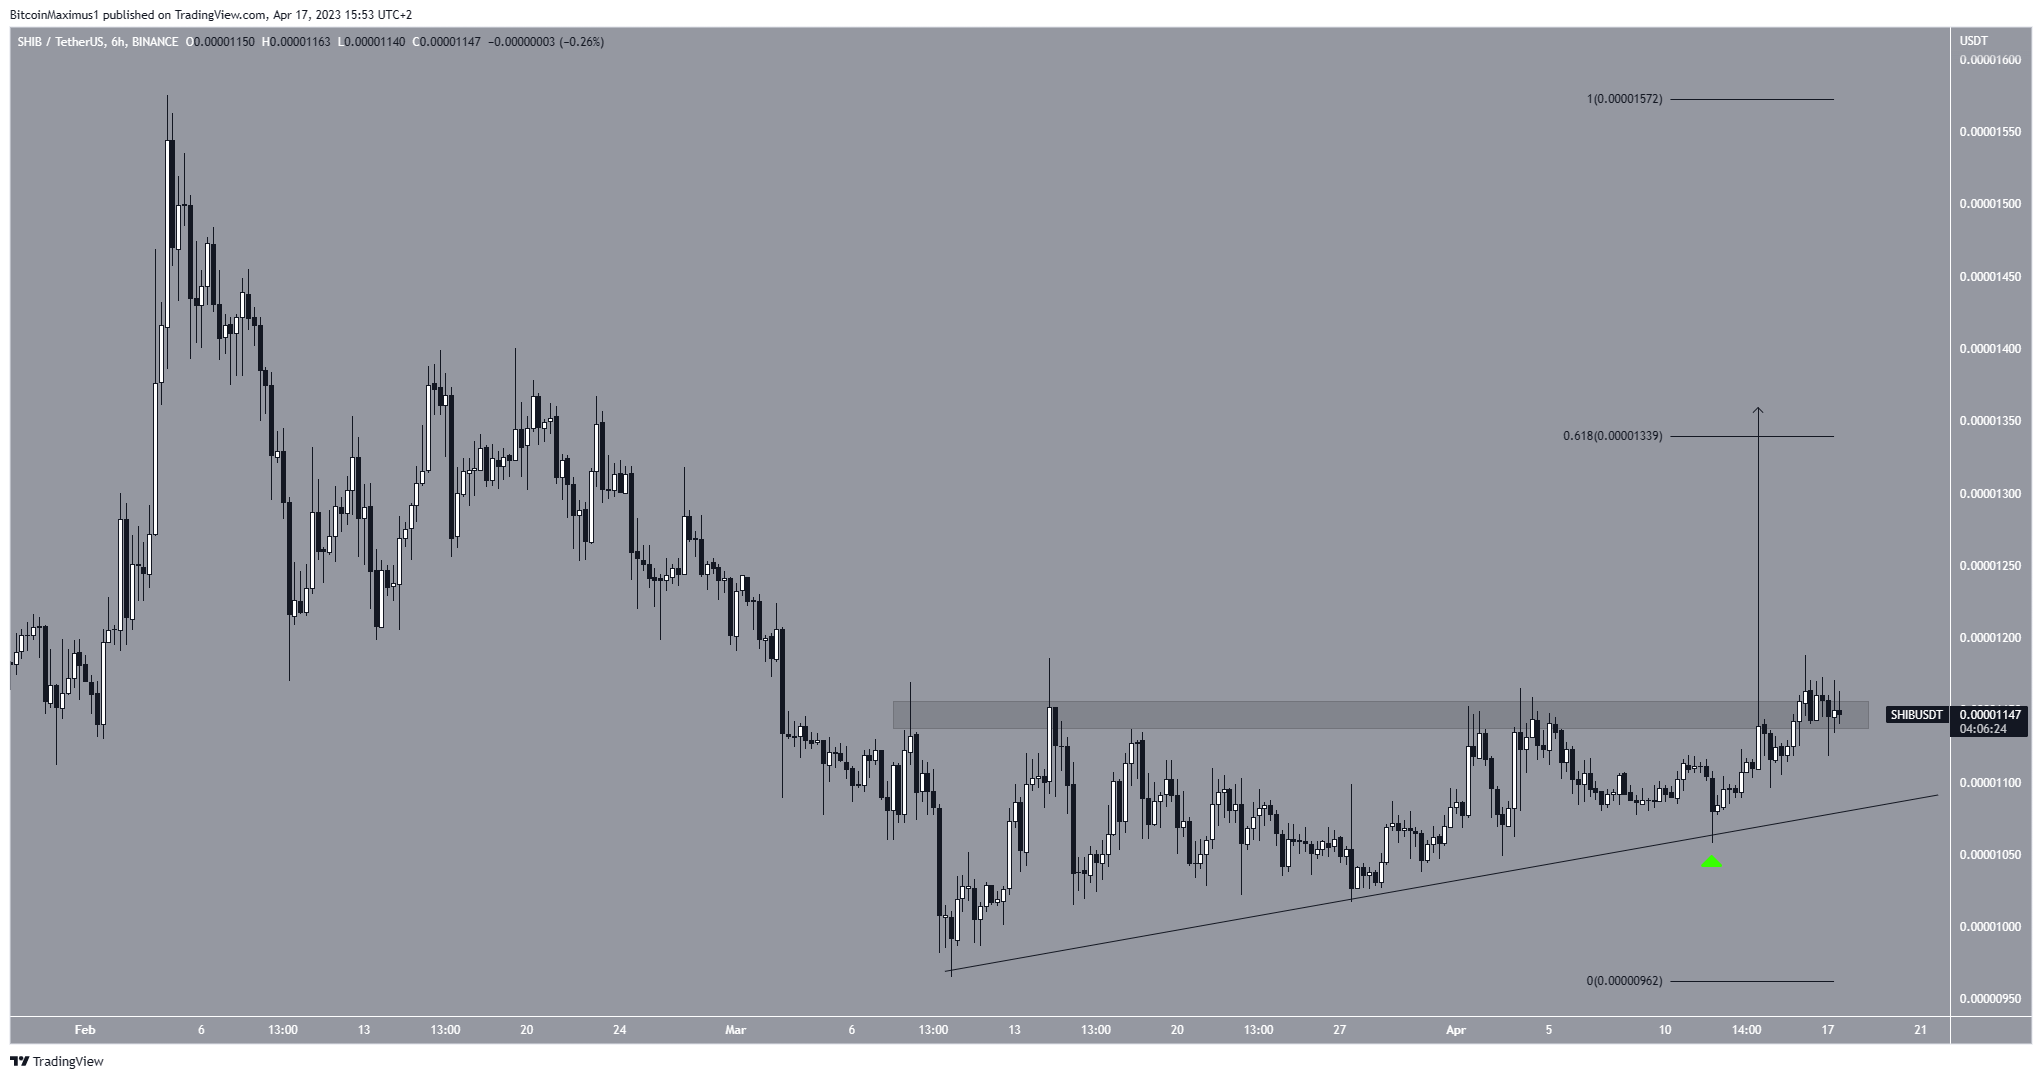
SHIB/USDT Six-Hour Chart. Source: TradingView
However, a close below the triangle’s support line would invalidate this bullish SHIB price prediction. In that case, the price could fall to the previous support at $0.0000100.
For BeInCrypto’s latest crypto market analysis, click here.


 Bitcoin
  Ethereum
  Tether
  USDC
USDC  Dogecoin
  Cardano
  Stellar
  Bitcoin Cash
  Hedera
  Litecoin
  LEO Token
  OKB
OKB  Algorand
  Cosmos Hub
  VeChain
  Gate
Gate  KuCoin
  Tether Gold
  IOTA
IOTA  Zcash
Zcash  TrueUSD
  NEO
NEO  Polygon
  Decred
  Synthetix Network
  Basic Attention
  0x Protocol
  Ravencoin
  Siacoin
  Holo
Holo  DigiByte
  Enjin Coin
  Nano
Nano  Waves
Waves  Ontology
  Status
  Numeraire
  Steem
Steem  Pax Dollar
  BUSD
BUSD  OMG Network
  Ren
Ren  Augur
Augur