


This Scenario Suggests the Ethereum (ETH) to Bitcoin (BTC) Price Could Hit a 5-Year High

The Ethereum (ETH) price has reached a descending resistance line, a breakout above which could trigger a sharp upward movement. Since the ETH/BTC pair has already broken out from its resistance, the ETH price is expected to outperform Bitcoin (BTC).
Despite the ongoing bear market, ETH staking has remained popular. However, only 20% of all the staked Ethereum is currently profitable. There is a large chunk of staked ETH at $1,300, so the ongoing increase has made it profitable. However, the vast majority of ETH has been staked between $2,500 and $3,500 and is in a significant loss.
Ethereum is also primed to undergo another network upgrade called Shanghai in March. This is the first major upgrade since ETH 2.0 and could have a positive effect, since it would allow stakers to withdraw their assets at any time.
Ethereum Price Reaches Resistance
The Ethereum price has fallen below a descending resistance line since reaching a maximum price of $2,030 on Aug. 14. The downward movement led to a minimum price of $1,073 on Nov. 9. The ETH price has increased since then.
Currently, ETH is attempting to break out from a confluence of resistances at $1,330. The resistance is created by the aforementioned resistance line and the $1,330 horizontal resistance area. As a result, a breakout above it could confirm the bullish ETH price forecast.
On the other hand, a rejection could lead to a fall to the short-term ascending support line at $1,230.
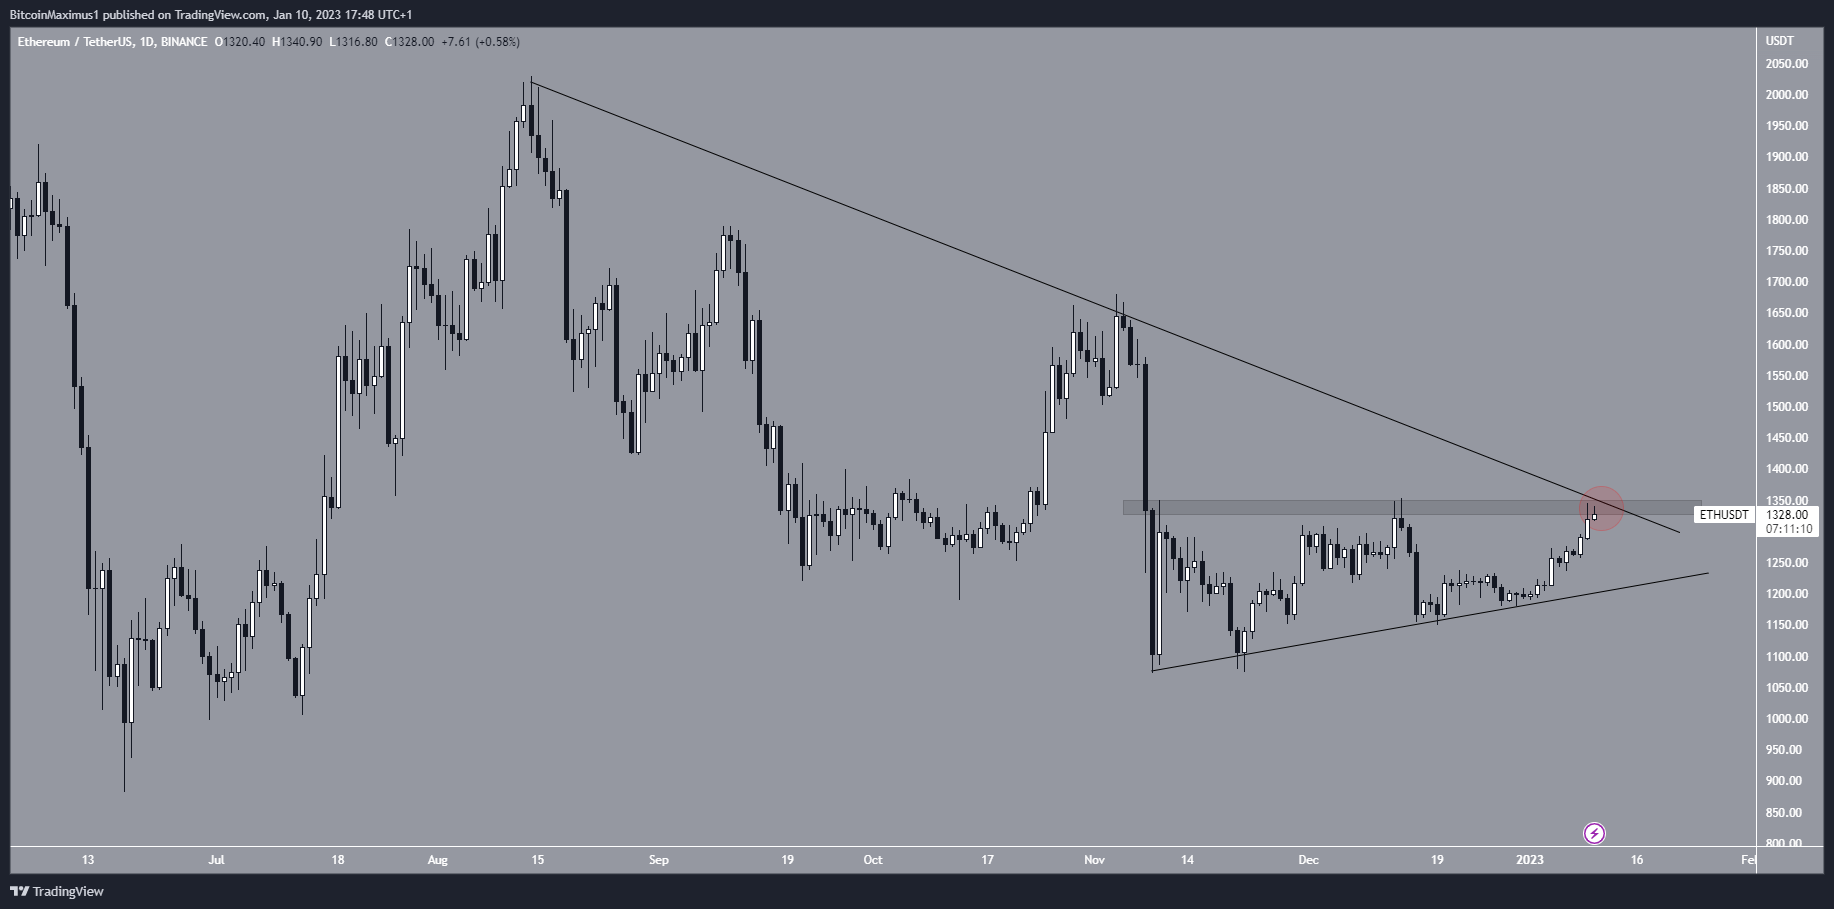
ETH/USDT Daily Chart. Source: TradingView
ETH/BTC is Primed For a Rally
Except for two deviations (red circles), the Ethereum/Bitcoin pair has traded below the ₿0.077 resistance area since the beginning of May 2021. Even though deviations above an area are considered bearish signs, the price is showing strength by making future breakout attempts.
Over the past four months, the ETH/BTC pair has decreased inside a symmetrical triangle. The price broke out from it last week and is attempting to move above the ₿0.077 resistance. A breakout that travels the entire height of the triangle would take the ETH price to ₿0.096. This also coincides with the 1.27 external Fib retracement of the preceding drop. If the increase continues, the 1.61 external retracement would be at ₿0.012.
The weekly RSI is also bullish. It broke out from a bearish divergence trend line and is now above 50.
As a result, the weekly time frame readings for ETH/BTC are bullish, and a close above the ₿0.077 resistance area would confirm the bullish trend.
On the other hand, a rejection from this area could lead to a re-test of the ₿0.065 support area.
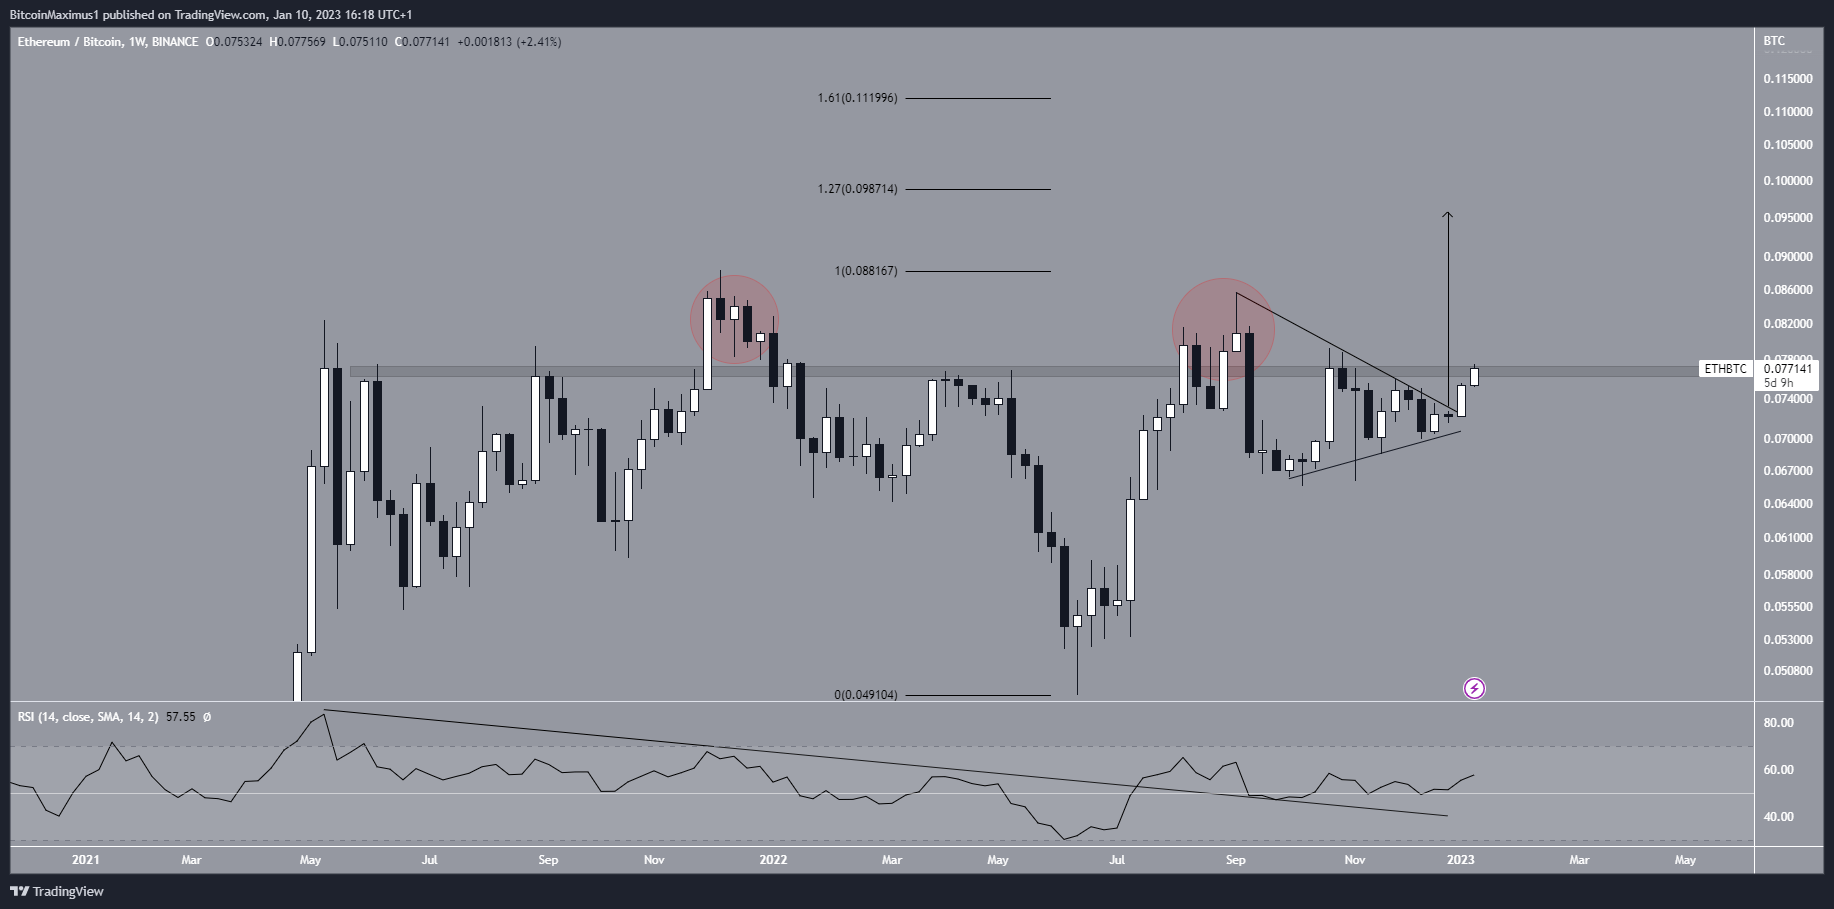
ETH/BTC Weekly Chart. Source: TradingView
To conclude, the direction of the future trend of the ETH/USD pair is unclear. It could be determined by whether the price breaks out or gets rejected from the descending resistance line. However, the ETH/BTC pair has bullish price action and can confirm its bullish reversal by closing above the ₿0.077 resistance area.


 Bitcoin
  Ethereum
  Tether
  USDC
USDC  Dogecoin
  Cardano
  Bitcoin Cash
  Polygon
  Litecoin
  LEO Token
  Hedera
  Cosmos Hub
  Stellar
  OKB
OKB  Maker
Maker  Algorand
  NEO
NEO  Gate
Gate  KuCoin
  Synthetix Network
  IOTA
IOTA  Tether Gold
  TrueUSD
  Enjin Coin
  Holo
Holo  0x Protocol
  Ravencoin
  Siacoin
  Basic Attention
  Zcash
Zcash  Decred
  Ontology
  Lisk
Lisk  Waves
Waves  DigiByte
  Status
  Pax Dollar
  Numeraire
  Nano
Nano  Steem
Steem  OMG Network
  BUSD
BUSD  Ren
Ren  Bitcoin Diamond
  Bytom
Bytom  HUSD
HUSD  Energi
  Augur
Augur