


Why the MATIC price could fall toward $0.60 in October

- MATIC price has rallied 20% since the middle of September.
- Polygon price faces significant resistance near the upper bounds of a descending trend channel.
- Invalidation of the bearish thesis is a breach above $1.05.
MATIC price could witness a sweep-the-lows-liquidation event in the coming weeks. Key levels have been identified.
Matic price shows multiple bearish signals
Matic pride shows a few factors suggesting the uptrend may be waning. Since the middle of September, MATIC has rallied 20%. The Volume Profile Indicator shows a very sparse reading in contrast with the previous MATIC bullrun during the summer. The indicator could suggest that the uptrend is losing strength.
Matic price currently auctions at $0.83. In addition to the low volume, the Relative Strength Index affirms that the uptrend is in jeopardy. Before the current uptrend rally, MATIC bottomed out in the oversold territory. MATIC now faces a key resistance level that forged the last decline at $0.93 into the lows at $0.69. There is also a divergence between the highs.
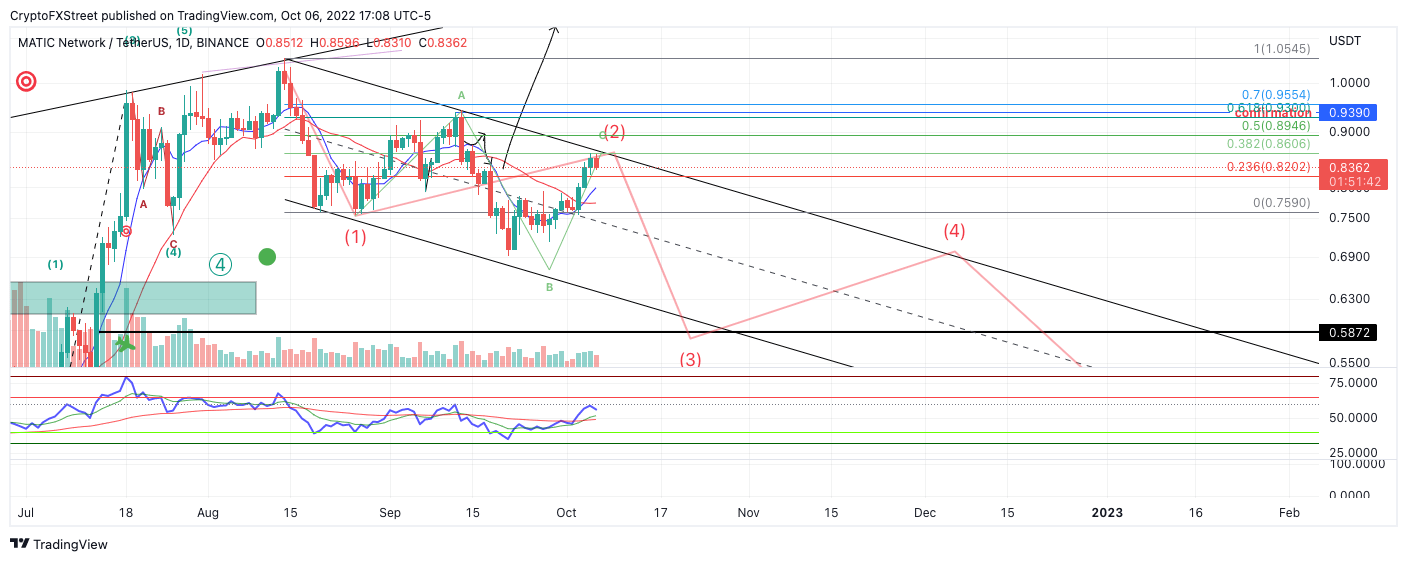
MATIC/USDT 1-Day Chart
Combining these factors, Polygon’s MATIC price could set up a sweep-the-lows event targeting the $0.60 congestion zone established in June. Said price action would result in a 25% decline from the current price levels.
Invalidation of the bearish thesis can occur if the bulls hurdle the swing high at $1.05. Traders with a heavier risk tolerance could also use the $0.91 swing high. If the bulls manage to breach the $0.91, a rally toward $1.20 would be on the cards. Such a move would result in a 45% increase from the current MATIC price.


 Bitcoin
  Ethereum
  Tether
  USDC
USDC  Dogecoin
  Cardano
  Bitcoin Cash
  Polygon
  Litecoin
  LEO Token
  Hedera
  Cosmos Hub
  Stellar
  OKB
OKB  Maker
Maker  Algorand
  NEO
NEO  Gate
Gate  KuCoin
  Synthetix Network
  IOTA
IOTA  Tether Gold
  TrueUSD
  Enjin Coin
  Holo
Holo  0x Protocol
  Ravencoin
  Siacoin
  Basic Attention
  Zcash
Zcash  Decred
  Ontology
  Lisk
Lisk  Waves
Waves  DigiByte
  Pax Dollar
  Status
  Numeraire
  Nano
Nano  Steem
Steem  OMG Network
  BUSD
BUSD  Ren
Ren  Bitcoin Diamond
  Bytom
Bytom  HUSD
HUSD  Energi
  Augur
Augur