

Итоги недели: биткоин протестировал $29 000, а CFTC подала иск против Binance

Цена биткоина протестировала отметки выше $29 000, CFTC подала иск против Binance и Чанпэна Чжао, MicroStrategy докупила 6455 BTC на $150 млн и другие события уходящей недели.
Биткоин протестировал отметки выше $29 000
Утром 30 марта биткоин протестировал отметки выше $29 000. На пике цена достигла $29 184 (на бирже Binance), что соответствует уровню июня 2022 года.
К выходным котировки скорректировались. На момент написания цифровое золото торгуется вблизи $28 000.
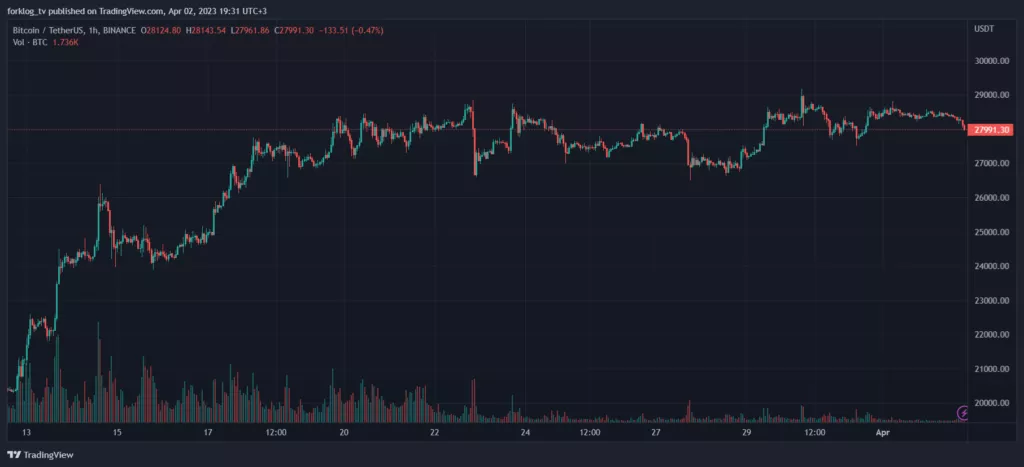
Часовой график BTC/USDT биржи Binance. Данные: TradingView.
По итогам недели большинство цифровых активов из топ-10 по капитализации оказались в «зеленой зоне». Исключение стала BNB Coin (BNB). Цена криптовалюты снизилась на 3,6%. Лучшую динамику показал XRP — котировки снизились на 17%.
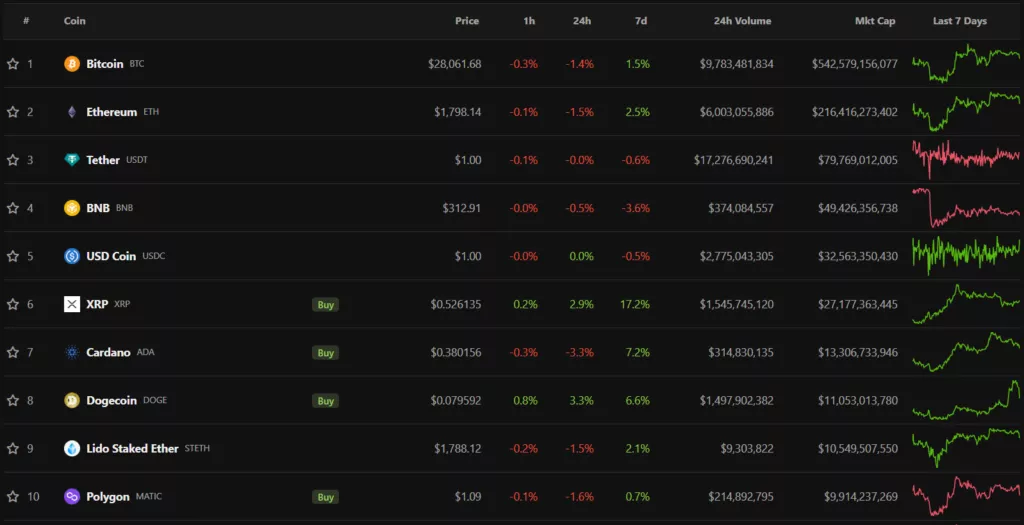
Данные: CoinGecko.
Совокупная капитализация криптовалютного рынка составила $1,22 трлн. Индекс доминирования биткоина снизился до 44,6%.
CFTC подала иск против Binance и Чанпэна Чжао
Комиссия по срочной биржевой торговле США (CFTC) подала иск против криптовалютной биржи Binance и ее главы Чанпэна Чжао. По мнению регулятора, платформа нарушила правила торговли деривативами, работая без соответствующей регистрации.
Чжао назвал иск ведомства «неожиданным и разочаровывающим», поскольку биржа сотрудничала с CFTC более двух лет. В свою очередь глава Комиссии Ростин Бенам заявил, что действия Binance являются явным случаем уклонения от закона, поэтому власти США должны были «вмешаться агрессивно и как можно быстрее».
После этого суд южного округа штата Нью-Йорк приостановил сделку по покупке Binance.US активов Voyager Digital. В СМИ также появилась информация о связях Binance с Китаем.
Экс-главу FTX обвинили в подкупе китайских чиновников
Экс-главу FTX Сэму Бэнкмана-Фриду обвинили в подкупе китайского чиновника с целью разморозить счета Alameda Research. Из судебных документов следует, что сумма взятки составила $40 млн.
По данным Reuters, Бэнкман-Фрид не собиирается признавать себя виновным. Он также не планирует идти на сделку со следствием ни по одному из других пунктов обвинений, в совокупности по которым ему грозит более ста лет тюрьмы.
Накануне экс-главе FTX согласовали новые условия освобождения под залог. Он получит телефон без доступа к интернету и ноутбук с ограниченной функциональностью, с которого разрешено посещать только утвержденные веб-сайты. Использование любых других электронных средств связи запрещено.
Также стало известно, что Бэнкман-Фрид оплатил судебные издержки из подарка, который сделал своему отцу на взятые взаймы у платформы деньги. В 2021 году он перевел ему $10 млн за счет кредита Alameda Research.
В конце недели регулируемая Комиссией по ценным бумагам и биржам Кипра FTX Europe запустила специальный веб-сайт, функционал которого позволяет европейским клиентам обанкротившейся платформы отправить запрос на вывод средств. Клиенты FTX Trading, где обслуживалась большая часть пользователей биржи, получили накануне электронные письма с указанием балансов на момент ее закрытия.
MicroStrategy докупила 6455 BTC на $150 млн
Согласно отчету в Комиссию по ценным бумагам и биржам США (SEC), в период с 16 февраля по 23 марта 2023 года MicroStrategy докупила около 6455 BTC за ~$150 млн по средней цене $23 238. Она удерживает 138 955 BTC на сумму $4,14 млрд.
Компания также погасила кредит Silvergate в размере $205 млн со скидкой 22%.
Fragment добавил оплату премиум-подписок для Telegram в TON
Маркетплейс Fragment от Telegram добавил возможность покупки премиум-подписки для мессенджера за токен Toncoin (TON) со скидкой 20%.
На неделе команда стейблкоина True USD (TUSD) стала партнером The Open Network. Сотрудничество позволит пользователям быстро и безопасно переводить актив в сеть TON через Orbit Bridge.
Что с До Квоном
Министр юстиции Черногории Марк Ковач сообщил, что CEO Terraform Labs До Квона осудят в стране до процесса экстрадиции, которого добиваются США и Южная Корея. Сам Квон намерен подать апелляцию на решение о продлении срока ареста до 30 дней.
Также стало известно, что Квон зарегистрировал компанию в Сербии через три недели после выдачи Интерполом «красного уведомления» в сентябре 2022 года.
Что обсудить с друзьями?
- Ирландский фермер научился добывать биткоин с помощью коровьего навоза.
- Gucci заключил партнерство с Yuga Labs.
- Создатель «Черепа Сатоши» признал свою неправоту касательно Proof-of-Work.
- Хакеры похитили биткоины в 52 странах через фейковый браузер Tor.
Гэри Генслер: правила для регулирования криптокомпаний в США уже существуют
Глава SEC Гэри Генслер выразил уверенность, что деятельность криптовалютных компаний должна регулироваться в соответствии с законодательством о ценных бумагах. Он также повторил свой тезис о том, что подавляющее большинство цифровых активов, за исключением биткоина, подпадают под это определение.
На этой неделе регулятор обвинил криптоторговую платформу Beaxy и ее руководителей в незарегистрированной деятельности в качестве биржи ценных бумаг, брокера и клирингового агентства.
DEX SafeMoon потеряла $9 млн в результате взлома
Неизвестный скомпрометировал пул ликвидности децентрализованной биржи SafeMoon на BNB Chain и вывел активы на сумму около $9 млн. Эксперты PeckShield предположили, что баг, который использовал хакер, появился в результате предыдущего обновления кода функции сжигания.
Через несколько часов после инцидента неизвестный отправил на адрес развертывания SafeMoon транзакцию с подписью:
«Эй, расслабьтесь, мы случайно зафронтранили атаку против вас и хотели бы вернуть средства. Давайте установим безопасный канал связи и поговорим».
В BNB Chain предложили снизить комиссии
На рассмотрение сообщества BNB Chain вынесено предложение о снижении транзакционных комиссий в протоколе консенсуса BSC в ответ на растущую конкуренцию со стороны L2-решений. Целевой порог установлен на уровне $0,005.
Команда Sui Network запустила «перманентный тестнет» проекта
Основанный экс-инженерами Meta стартап Mysten Labs представил «перманентный тестнет» Sui Network
Тестовая сеть продолжит работу после запуска основной, а хранящиеся в ней данные не будут стираться после каждого обновления программного обеспечения. Запуск мейннета проекта запланирован на II квартал 2023 года.
Правительство США продало 9861 BTC за $215 млн
14 марта власти США продали 9861 BTC на общую сумму около $215,7 млн. Реализованные активы составили лишь часть из более 50 000 BTC, конфискованных у Джеймса Чжуна в ноябре 2021 года. Он признал вину в их незаконном получении на даркнет-маркетплейсе Silk Road.
Читайте также:
- Биткоин-биржа Bittrex свернет операции в США.
- Сеть THORChain приостановила работу из-за уязвимости.
- Binance открыла региональный хаб в Грузии.
- Беларусь продлила налоговые льготы для биткоин-индустрии до 2025 года.
Что почитать на выходных
Децентрализованное наследие Павла Дурова — The Open Network — активно развивается. Однако одним из главных рисков проекта остается централизация из-за чрезмерной концентрации utility-токенов среди небольшого числа участников экосистемы, связанных с TON Foundation.
ForkLog выяснил, кто контролирует большинство добытых на премайне активов.
Вместе с командой децентрализованного протокола безопасности HAPI Labs разобрались, как «грязная» криптовалюта становится «белой» и каким образом AML-сервисы должны маркировать ее в дальнейшем.
Редакция ForkLog AI протестировала новую версию нейросети GPT-4, доступ к которой открыли подписчикам ChatGPT Plus, выяснила ее возможности сравнила с алгоритмом GPT-3.5.
В последний день марта журнал ForkLog подготовил календарь важных событий следующего месяца.
В традиционных дайджестах собрали главные события за неделю в сферах кибербезопасности и искусственного интеллекта.
Криптовалютная индустрия привлекает все большее число институциональных игроков. Об этом говорят и новые инвестиции в инфраструктуру, и все более пристальное внимание, которое компании проявляют к биткоину как классу активов. Наиболее важные события последних недель — в обзоре ForkLog.


 Bitcoin
  Ethereum
  Tether
  USDC
USDC  Dogecoin
  Cardano
  Bitcoin Cash
  LEO Token
  Stellar
  Litecoin
  Zcash
Zcash  Hedera
  Tether Gold
  OKB
OKB  KuCoin
  Gate
Gate  Algorand
  VeChain
  Cosmos Hub
  TrueUSD
  IOTA
IOTA  Basic Attention
  Decred
  NEO
NEO  Synthetix
  0x Protocol
  Ravencoin
  DigiByte
  Nano
Nano  Siacoin
  Numeraire
  Waves
Waves  Ontology
  Status
  Enjin Coin
  Pax Dollar
  BUSD
BUSD  Steem
Steem  OMG Network
  Augur
Augur  Ren
Ren  HUSD
HUSD